-
CENTRES
Progammes & Centres
Location
 PDF Download
Introduction
Introduced in 2000 by the coalition of Social Democrats and Greens (1998–2005), Energiewende became the blueprint for Germany’s ambitious energy policy goals towards “an environmentally sound, reliable and affordable energy supply.”1 Energiewende was first used in a
|
|
Table 1. |
|
||
|
|
2020 |
2030 |
2040 |
2050 |
|
Nuclear Power |
exit |
|
|
|
|
Increase in share of renewables in gross final energy consumption |
18% |
30% |
45% |
60% |
|
Increase in share of renewable energy in gross electricity consumption |
35% |
50% |
65% |
80 |
|
Reduction of greenhouse gas emissions (compared to 1990) |
–40% |
–55% |
–70% |
–80–95% |
|
Reduction of primary energy consumption |
–20% |
|
|
–50% |
|
Reduction of electricity consumption (compared to 2008) |
–10% |
|
|
–25% |
|
Reduction of heating demand in buildings |
–20% |
|
|
–80% |
|
Increasing energy productivity to 2.1 percent per year in terms of final energy consumption |
||||
Source: German Federal Ministry for the Environment, Nature Conservation, Building and Nuclear Safety.4
These policies, however, seem unrealistic, especially considering that Germany, one of the world’s economic powerhouses, generates only 30 percent of its energy with internal resources.5 Germany is highly dependent on imported raw materials to run its export-oriented
Today, the global trend seems to point in the reverse direction. According to the Global Coal Exit List, over 400 companies worldwide are planning to expand their coal activities. More than 1,600 new coal plants and units are planned or under development in 62 countries.8 If built, these new plants would increase the world’s installed coal capacity by over 42 percent.9 The same trend is observed in nuclear energy. About 440 nuclear power reactors are currently operating in 30 countries, and 50 new power reactors are under construction in 13 countries, notably in China, India, UAE and Russia.10 Most reactors currently planned are in the Asian region, with fast-growing economies and rapidly rising electricity demand. In all, over 160 power reactors are on order or planned, and over 300 more have been proposed.11
While the rest of the world might be ramping up conventional sources of energy, Germany strives for the opposite. There are three aspects to be conceded, which offer both critics and supporters of the energy transition a viable argument:
1. Against many critical voices, Germany has exceeded its planned capacities in renewable energy.
2. Several targets such as energy productivity, consumption and share of renewables in the transport sector have not been met.
3. The central goal of a 40-percent reduction in GHG emissions until 2020 will not likely be met due to the current gap between quota and target.12
Figure 1: Overall Assessment by Expert Commission on Meeting 2020 Targets
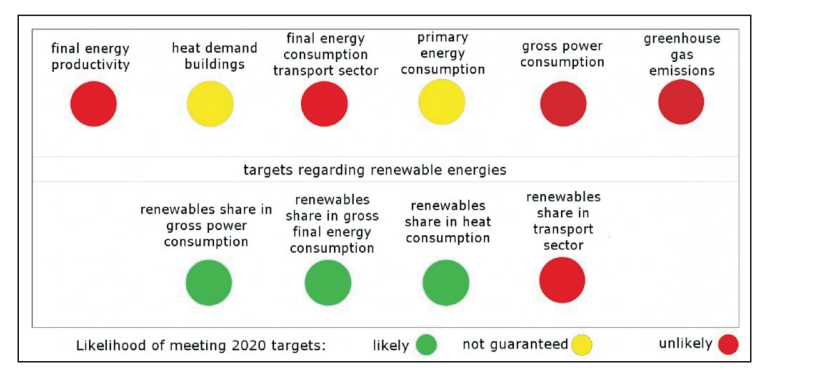
Source: Monitoring Report 2016/cleanenergywire.13
In a 2014 survey, Indian experts described Energiewende as “extraordinary, […] setting benchmarks worldwide” but also acknowledged that “Germany is implementing its transition at an unusually quick pace.”14 The German public, on the other hand, sees Energiewende as an unavoidable and necessary step. The current progress is perceived as unsatisfactory, with plenty of room for improvement: 88 percent of the German public supports the energy transition and is critical of the foreseeable failure to meet the 2020 emission goals. Most supporters of all parties represented in the German Parliament back this project. Even among the 77 percent of people who are sceptical about climate change, Energiewende and its 2050 goals15 are not questioned. Around 63 percent of the whole population advocates for an exit from lignite, the largest contributor of GHG emissions in Germany.16 A study initiated by the German Industry Federation (BDI) has concluded that the 2050 goals might be realistic if political engagement is intensified.17
In 2011, the German Advisory Council on the Environment (SRU) ran eight scenarios and came to the conclusion that a transition to 100 percent renewable energy by 2050 is possible.18
In this context, the following questions must be answered:
B) What is the status quo, the dependencies and developments in the European and global context?
I. From Bottom-up to Brussels-down
Germany’s decision to leave the nuclear age behind and progress into a carbon-neutral future at the same time was, and still is, hard to understand for observers from abroad. While historically, the shift from one dominating power source to another—coal to fossil fuels—was initiated and driven by economic and rational reasons, Energiewende and the transition to renewables was born out of an emotional and moral civil movement against a rational and empiric global mainstream.
The roots of German environmental awareness go back to 1713, with the creation of the first comprehensive treatise on sustainable
Later in the mid-19th century, when side effects of the
Environmental policies
Angela
The peaceful revolution in East Germany, which had led to the German Reunification in 1990, was another grassroots movement. It played a key role for the climate discourse, not only in Germany but also in Europe and the world.
In the years after the
“The base year of 1990 was very advantageous to European countries. In the UK, you had already experienced the ‘dash for gas’ from coal - then in Germany they merged Eastern Germany where tremendous restructuring occurred.”37
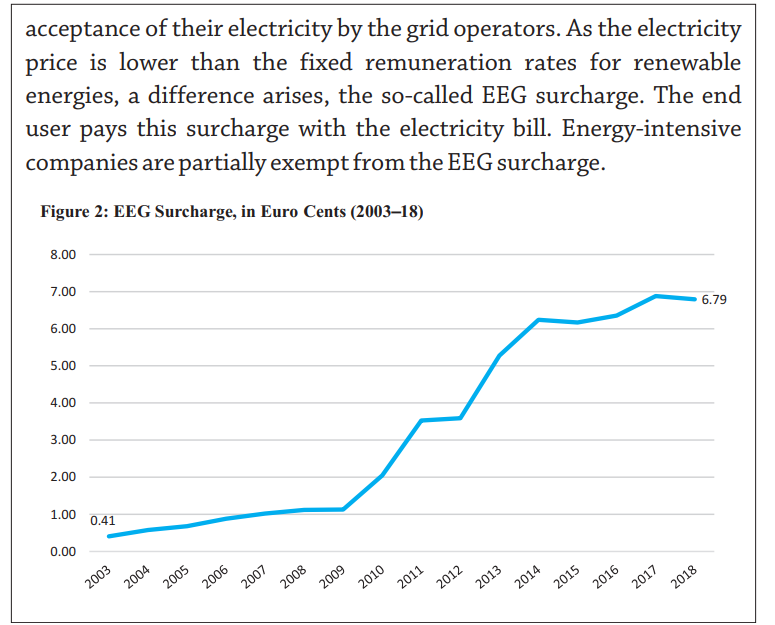
Phasing out nuclear energy and reducing GHG emissions required a viable alternative. It became necessary to resolve tensions between affordability, security and reliability, to provide a roadmap flanked by concrete limitations and stimulations. Energiewende’s legal backbone is the Renewable Energy Sources Act (Erneuerbare Energien Gesetz, EEG) initiated in 2000.38 It guarantees long-term security for investments to overcome teething troubles, attract enough investment in renewables to stimulate mass production to achieve economies of scales, and reach a minimum share in gross power consumption of 80 percent in 2050, without further financial assistance at a later state.39

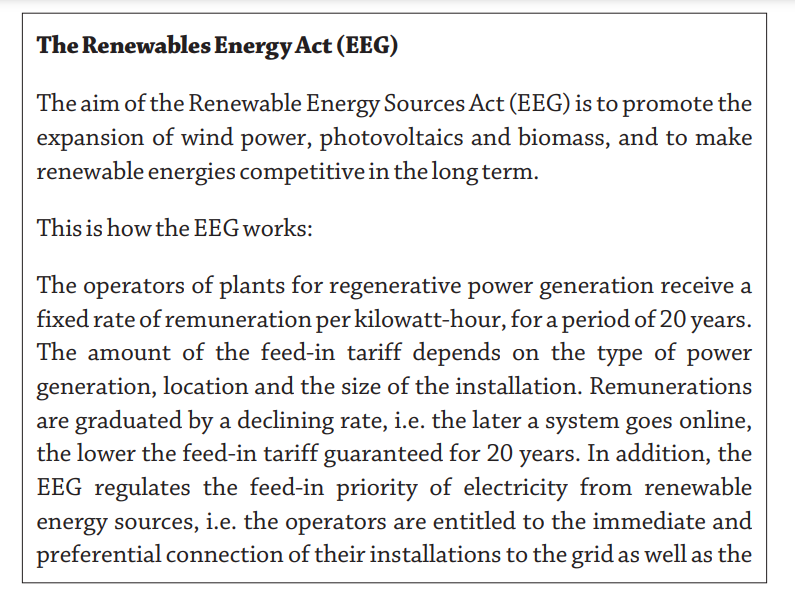
Source: German Federal Centre for Political Education (2013)40/German Federal Network Agency, 2018.41
II. The German Reality: Developments and Challenges
A. Flow of Funds
The reality of Energiewende is by far more complicated than the historic retrospect might offer. Both the legal framework and the figures are enormous. A total amount of €520 billion (2000–25) is funded solely by a premium on every kWh consumed.47 Grid operators must refund the producers of renewable energy with a fixed price and allocate these costs to the end consumer. The higher the difference between market prices and the guaranteed feed-in tariff, the higher the EEG allocation. Today, a regular household in Germany has an annual power bill of €1,100, of
In addition to costs for
The following
Source: German Federal Ministry for Economic Affairs and Energy, 2017.50
However, the EEG allocation is expected to level out from 2020. The latest tenders for offshore wind already exclude any such a stimulating tool due to lower investment costs and higher efficiency.51
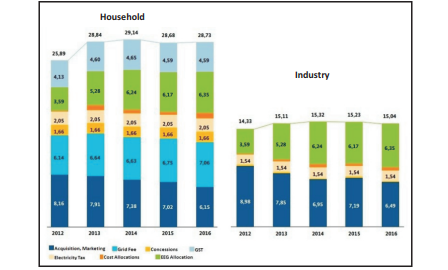
The electricity price does not accurately reflect the total costs. While the extra charge for renewables becomes obvious in the electricity bill, expenditures for other energy sources covered by the government (financial aid, tax benefits and other favourable frameworks) are not included and, therefore, invisible. To get a clearer picture on government facilitation, the following calculation identifies the hidden expenditures for all energy sources covered by the tax payer.
Figure 4: Government Facilitation in Billion Euro, by Technology (1970–2016)
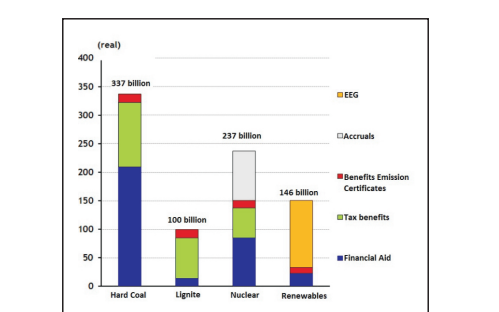 Source: Forum Ökologisch-Soziale Marktwirtschaft e.V., 2016.52
Figure 5: Ownership of Renewable Energy Production in Germany (2016)
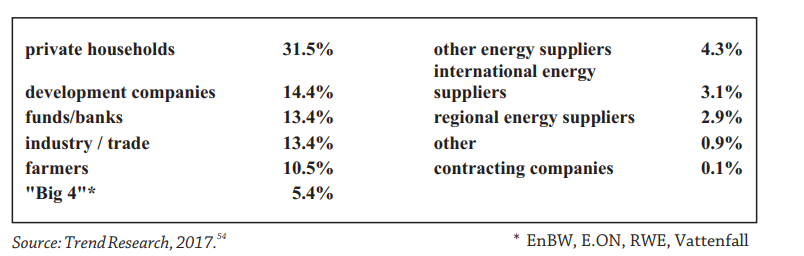
Renewables—sweetened with special government credits—became a lucrative, secure and affordable investment for every citizen. As more (renewable) energy became available, the wholesale price for electricity (supply) and renewables (advanced technology, economy of scales) dropped. The additional supply of renewables entering this field of competition every year is a key element of an industry-friendly development. But the decentralisation has hurt the “Big 4” energy companies running base-load power plants on fossil and nuclear fuels. In 2015, E.ON and RWE wrote off their conventional power plants by a total of €11 billion (80 percent in the case of E.ON). Not even one of their
However, several of these fossil-fuelled power plants were not liquidated. They deferred their availability for periods of extreme weather condition (cold reserve). Suitable reserve power plants, capable of providing the reserve service in a timely and targeted manner, are still required. In February this year, the EU agreed that Germany tenders a capacity reserve of 2 GW for the period between 2019 and 2025. This standby reserve is only to be used for covering a potential capacity deficit. To reduce the necessity for this on-demand supply in the future, electricity suppliers who are unable to meet their delivery obligations will have to pay a proportion of the total cost of the reserve commensurate to their contribution. The minimum price for suppliers who are unable to cover their obligations will be €20,000 per MWh. In 2017, the average wholesale price on the day-ahead market was €34 per MWh. As a result, suppliers will have a strong incentive to hedge their delivery obligations through forward transactions or agreements with their customers at an early stage. 56
Current figures reveal the inconsistent and unpleasant reality of Germany’s green future. The focus on the energy sector and the transition to renewables made sense, as 85 percent of GHG emissions are generated here. However, while Germany has achieved several of its goals, some issues have come to light.
a) Since 2009, there has been a certain stagnation in GHG emissions, with a slight increase in the second year in a row (2014–16).57 This is primarily caused by the growing transport sector.58
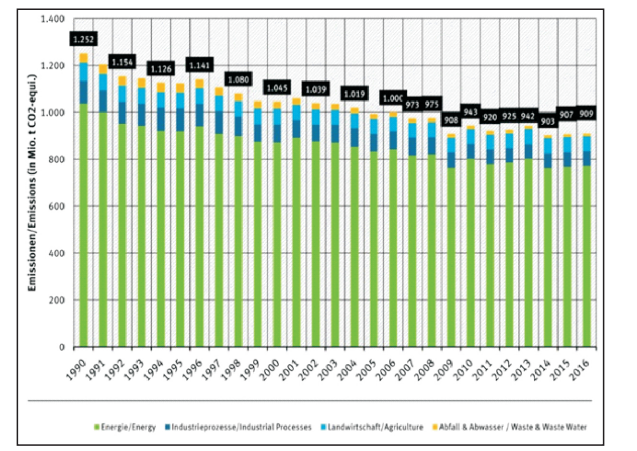
Source: German Federal Environment Agency.59
b) The growth in renewables is so high that on sunny and windy days, the energy production can cover more than two-thirds and temporarily even up to 95 percent.60 However, Germany is not yet able to distribute the renewable energy generated in the windy north to the economic powerhouses in the south.
c) Germany is ranked only 30th in the world in Yale University’s
Environmental Performance Index (EPI).61
Compared to other
countries, it is still one of the highest emitters of GHG in Europe, responsible for 20.8 percent of GHG emissions of the EU.62
d) The most powerful, yet one of the most energy-consuming economies in Europe, Germany still obtains approximately 54 percent of its power requirements from fossil fuels. The main polluter in the energy sector are lignite power plants, which still supply over 23 percent of the total energy produced.
Figure 7: Gross Power Production in Germany (2016) in TWh and Total Share (Percentage)
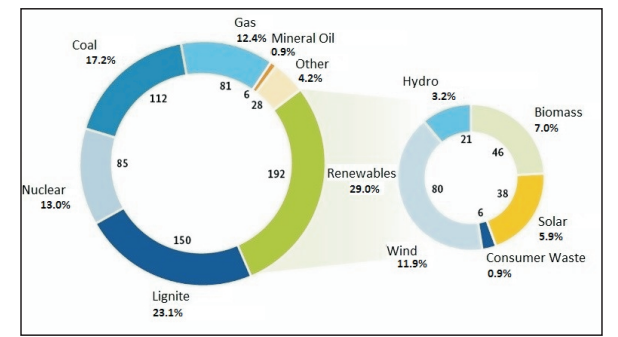 Source: German Federal Ministry for Economic Affairs and Energy, March 2017.63
In 2014, a McKinsey report said Germany might not be able to meet the 2020 targets due to the significant coal-based energy sector.64 While the latest report from the German government expects to miss its
Energiewende, a German NGO that attracted international awareness in September 2017,66 predicts a gap of 9–10 percent or 120 million tonnes
To contextualise these statistical figures, it must be taken into account that during this period of 26 years, Germany’s GDP grew by an additional 139 percent.
Figure 8: CO2 Emissions of the Energy Sector/GDP (1990/2000/2016)
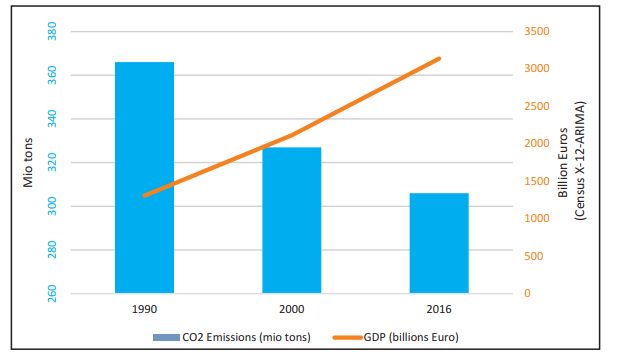
Source: Statistsches Bundesamt, 201767/ German Federal Environment Agency, 2016.68
Although these figures reflect the aspiration of decoupling growth from the emissions caused by the energy sector, the 2020 emission goals seem unreachable. In the climate discourse, economic growth has often diminished the gains in savings. As a result, the GHG gross emissions worldwide are still on the rise.
The main reason for the high GHG emissions in Germany is coal. This source of energy still provides over 40 percent of Germany’s electric power and causes—as per a study by an NGO (2016)—87 percent of GHG emissions in the energy sector (including for heat-generation purposes69 and 78 percent for electricity only), 28 percent related to hard coal, 50 percent to lignite.70
In 2016, 66 power plants71 accounted for around 78 percent of the total hard-coal consumption, the steel industry for around 20 percent. While currently only 10 percent of hard coal is from national sources, the reliance on imports will rise to 100 percent after 2018.72 In 2007, both
Figure 9: CO2 Emissions by Source in Germany Related to Power Generation (g/kWh)
![]() Gas 391
Gas 391
Hard Coal 863
Lignite 1,151
![]() Source: German Federal Environment Agency, 2017.75
Source: German Federal Environment Agency, 2017.75
Like in other countries, Germany’s policy-makers must handle the trilemma of maintaining economic growth of energy-intense industries, low national resources, and energy security. Because of Energiewende, there is now the additional dilemma that the country still relies on coal while self-determined ambitious environmental targets have to be fulfilled. In Germany, less than 20,000 people are employed in the lignite sector76 and all the 45 lignite power plants77 are in only three out of 16 states.78 Thus, the social costs for a shutdown would be relatively low. Gas, currently the only alternative source of power, is expensive and the
Therefore, the remaining
The power grid is the weakest link in the chain and requires continuous investments. In the latest grid plan, the Federal Network Agency scheduled around 3,050 km of optimisation and reinforcement measures in the existing grid and around 2,750 km of new routes added until 2024.84 The expected costs are about €15 billion for the connection to offshore wind parks and €18 billion for grid enforcement on land. However, these figures do not include the additional costs for underground cables on land.85
Figure 10: Solar and Wind Energy in Germany: Installed capacity by Postal Code Area, Megawatts/Square Mile
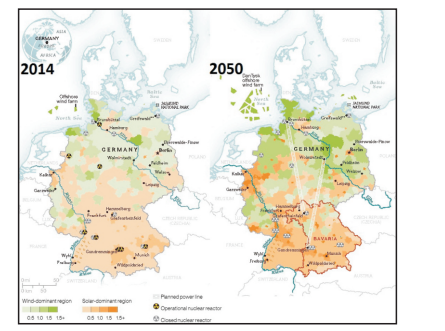
Source: National Geographic/Fraunhofer IWES; US Energy Information Administration, German federal Ministry for the Environment; Eurostat.86
So far, the grid seems to have kept up with the challenges. Although the strains on the grid are rising both in terms of numbers of suppliers and consumers, the incidents as well as duration of current interruption are continuously decreasing:
![]()


![]()
![]()
![]()
![]()
![]()
![]() Figure 11: Tabular List of Supply Interruptions, 2006–16 (Nationwide)
Figure 11: Tabular List of Supply Interruptions, 2006–16 (Nationwide)
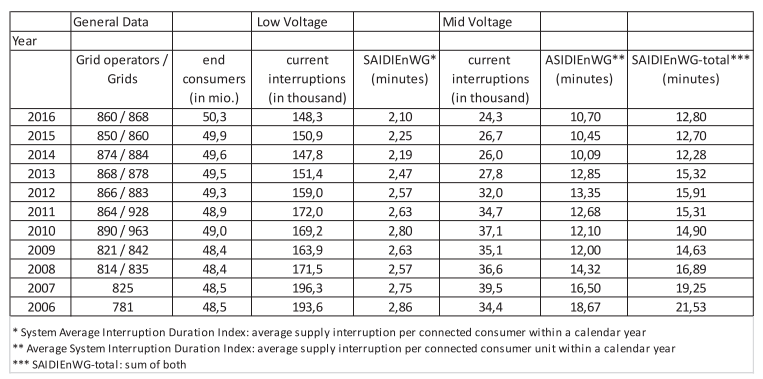
Source: German Federal Network Agency, 2017.89
a) residual-base power plants (demand higher than the supply; residual base is positive)
b) storage technologies (supply higher than demand; residual base is negative)
Flexibility in quantity and quality becomes the main attribute of “residual base.”
Figure 12: Gross Electricity Generation and Residual Load in Germany (Sample Week in April 2022 with 50 Percent Renewables)
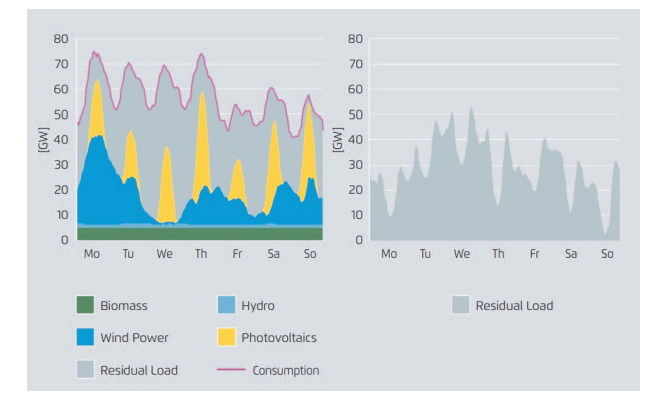
Source: Agora Energiewende.90
In 2011, a study predicted a systemic conflict in Germany and the end of classic base-load power plants from 2020.91 Four years later, another study declared the base-load principle as outdated and
a) thermal gas power plants, which can be quickly booted;
b) smart meter technologies, which regulate supply and demand by necessity and availability;93
c) storage technologies, e.g. thermal energy storage (TES) or power-to- X (PtX).94
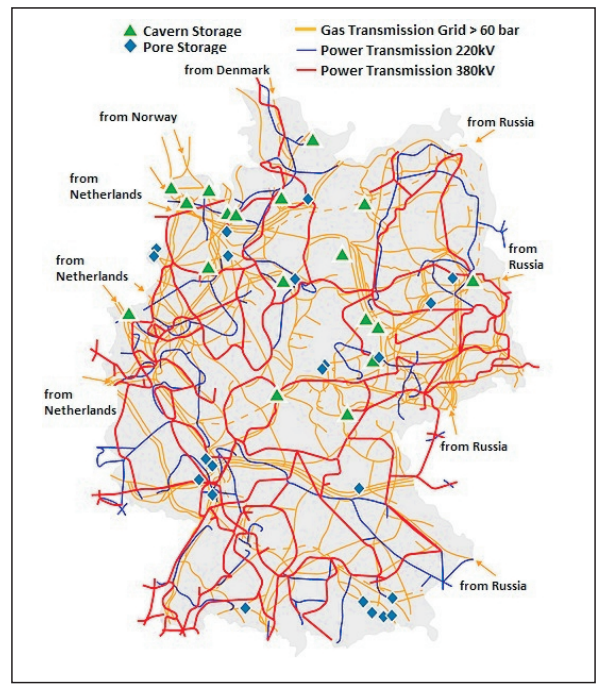
The latter seems to be the most attractive as there is the necessary infrastructure (gas-transmission grid) with a tremendous capacity already in place. While the storage capacity of electricity is currently 0.6 hours, the gas transmission grid can offer a buffer of 2,000 hours or three months.95 There are several options in PtX:96
1. Power-to-Heat (PtH) uses surplus electricity for the heating market; simple heating elements are fed into district-heating systems.
2. Power-to-Valuables (PtV) uses surplus electricity in industry for the targeted production of chemical products, compressed air, melting of metals, surface finishing processes etc.
3. Power-to-Mobility (PtM) uses excess electricity to charge electric vehicles. The car becomes a power storage and feeds energy back into the power grid. Alternatively, hydrogen and methane generated from power-to-gas processes can be used for CNG and LNG mobility.
4. Power-to-Liquid (PtL) uses surplus electricity through electrolysis/hydrogen production to usable basic chemicals (e.g. methanol). With this method, fuels can be obtained from synthetic hydrocarbons (dimethyl ester, kerosene etc.).
5. Power-to-Gas (PtG) uses surplus electricity through electrolysis (splitting water into hydrogen and oxygen). The optional subsequent
Source: Solares bauen GmbH. 97
The crucial element for this approach is coupling and aligning both gas- and power-transmission grids. Currently, 38 PtG projects for testing and feasibility studies are planned or in operation.98 Between 2019 and 2027, PtGs producing additional 1,500 MW, with estimated costs of €1.1 billion, are to be installed.99 Operators will receive carbon- emission certificates for every tonne of GHG avoided. This incentive tool helps reach break-even in the initial phase, as the certificates can be traded on the emissions market.100
III. The European Context
When discussing dependencies, the European context is a crucial aspect. There are two levels of the challenge to handle the indifferent power supply (and demand): national and international. The successive final shutdown of Germany’s remaining seven nuclear power plants until 2022,101 providing 13 percent of Germany’s electricity, will result in a gap of the power supply, which needs to be closed. In this context, Europe’s liberalised power market balances supply and demand in the continent. Germany can provide temporary power surplus to the rest of Europe, and in turn, power deficits in Germany can be eliminated by its neighbours’ supply. The necessary legal frame was established in 1996 when the European energy market was liberalised. From 2007 onwards, every household and industrial consumer was entitled to choose its energy supplier. 102 More and more power was crossing the borders.
Figure 14: Energy Flows: Import/Export, by Country in TWh (2017)
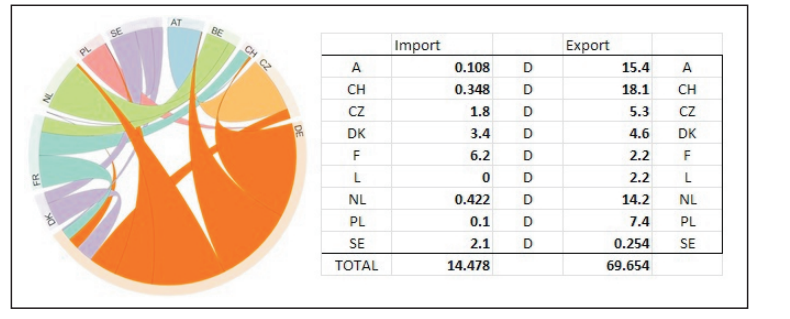
Source: Fraunhofer ISE, 2018.103
Germany usually consumes only 64 to 78 gigawatts of electricity daily. Conventional power plants, together with renewables, reach between 80 and 90 gigawatts on windy and sunny days.104 In other words, Germany can shut off 20 of its oldest lignite power plants only by reducing its energy exports. In case of a power shortage, several gas power plants—mostly on standby105—ensure the necessary energy
As explained in the preceding section, the principle of
In Europe, national interests still dominate the European disputes, which is clear from the latest discourse applauding a coal exit. While French President Emmanuel Macron and more than 20 other leaders of countries, states and organisations demanded a phase-out deadline of coal-generated energy and formed the Power Past Coal Alliance,108 Angela Merkel once again refused to fix any date at the COP 23 in
A lower rate of coal-power share corresponds to such a
Figure 15: Europe: Energy from Coal in Percentage (Declared Exit Year)
|
Poland |
81% |
Italy (2025)* |
15% |
|
Czech Republic |
54% |
UK (2025)* |
15% |
|
Greece |
46% |
Slovakia |
12% |
|
Bulgaria |
45% |
Finlandx(2030)* |
11% |
|
Slovenia |
30% |
Portugal (2020) |
10% |
|
Germany |
40% |
Austria (2025)* |
3% |
|
Romania |
27% |
France (2023)* |
3% |
|
Denmark* |
27% |
Sweden (2030) |
1% |
|
Ireland |
26%` |
Netherland (2030)* |
23% |
|
Spain |
20% |
Hungary |
20% |
|
Croatia |
18% |
Belgium*, Estonia, Lithuania, Latvia, Switzerland*, Luxemburg*, Norway |
0% |
|
[*Countries that had signed the Power Past Coal Alliance by 16 November 2017] |
|||
Source: Frankfurter Allgemeine Zeitung111/Powering Past Coal Alliance.112
Germany accepts gas as a source of energy (during transition, to cover residual load). Instead, countries of the former Warsaw Pact (today, most of them are members of the EU) such as Poland, identify gas as a threat to national security because the majority share has to be imported from Russia. Gas-powered generation causes a rising dependence due to a lack of sufficient gas fields and a decrease in domestic production in the EU. Theoretically, Germany and France are not dependent on gas imports. Due to either their current spare capacity in renewables and other fossil or nuclear-fuel powered plants, both countries can even increase their electricity exports without
Germany has the highest gas-storage capacities in
However, the country’s dependence on gas imports—foremost from Russia (>35 percent)115—is expected to increase with the phase-out of nuclear116 and might be another reason why Germany still sticks to lignite: Russia’s dependence is not as mutual as it might be expected.
While oil exports represent 50 percent of Russian annual GDP, gas exports add up to “only” five percent.117 The North Stream Pipeline, built from Russia through the Baltic Sea and delivering gas directly to Germany, is seen by many in the EU as a major threat. The Ukrainian–Russian gas conflict (“Gas War”)—which led, in winter 2008–09, to a 90 percent reduction of gas supplies transported via the Ukraine—was a showcase of EU’s reliance on the countries between Russia and Germany.118 Based on their history, it stands to reason that the relationship between Russia and Germany can be more pragmatic and rational than between Russia and its former vassal states. Even
Once introduced as a flagship of the European climate policy, the EU Emissions Trading System (EU ETS) has been developed as a market tool rather than a legal regulatory instrument to influence emitters’ behaviour—a market tool that works on the simple principle of demand and supply. The more greenhouse gases (GHG) an emitter produces, the more certificates—European Allowances (EUA)—are required, or more
Figure 16: Emissions, Allowances, Surplus and Prices in the EU ETS (2005–16)
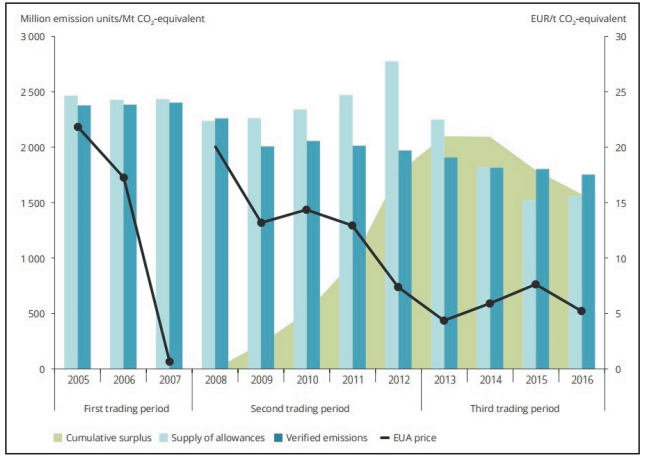
Source: European Environment Agency/Point Carbon, 2012; EEA, 2017; EEX, 2017; ICE, 2017.126
With a current price tag of €5 per million tonne of CO2, this instrument is playing in the same league as the latest calculations published by the US Environmental Protection Agency (EPA) under the current Trump administration, which elaborated a price of US$1 and US$6 for a carbon certificate representing one metric tonne from 2020 on.127 The EPA under the Obama administration had set a price of about US$50 per metric tonne, 128 which was even more ambitious than the OECD recommendations of US$30 necessary to influence the emitters’ behaviour and investment strategies.129
In 2008, all European economies, particularly the PIIG130 countries, were affected by the Global Finance Crisis. They had to cut public spending tremendously and suffered from low foreign direct investment (FDI). The weakness of the European economies and the relatively stable Euro was a gift for the biggest and strongest economy. Germany quickly recovered after two years, profiting from the effects of
Low fossil fuel and emission certificate
Moreover, EU ETS has had a negative effect on climate, because it is cheaper to buy and even more profitable to trade certificates instead of reducing carbon emissions. Even though every reform since the introduction of EU ETS has failed to reduce the existing number of certificates in sufficient quantities (backloading), the latest reform proposed by the European Commission seems to approach this issue more effectively—beginning only in 2020—but including an opt-out for “vulnerable industries.”132
IV. Global Perspective: Power Shifts
To tackle climate change successfully, it is necessary to consider the causes that have led to the present reality. Developed countries and their
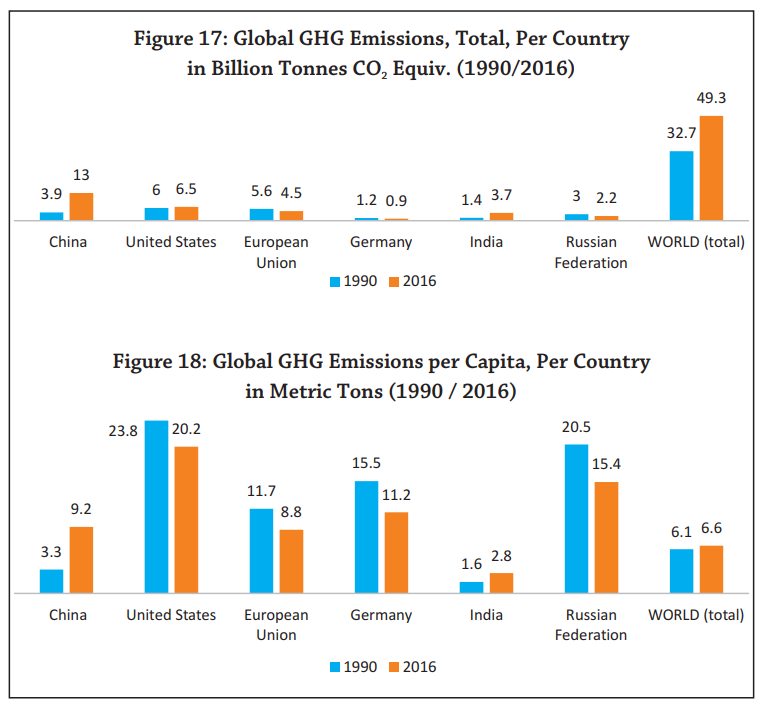 |
Source: PBL Netherlands Environmental Assessment Agency.133
This leads to resistance from developing countries in the climate- change dialogue with industrialised countries. It becomes a moral and thereby an emotional issue for both sides. Since developed countries have already economically profited from over a century of
The effects of climate change (e.g. droughts, rising sea-levels and storms) will further increase. A much higher flood risk than in previous calculations has already been predicted.134 It is to be expected that every flood and storm will generate and shape the environmental awareness in developing countries. This will create tremendous pressure on politicians and industries to adjust policies, practices and business models, but also on governments of industrialized countries to increase aid and assistance. In such a high emotional discourse, rational arguments go unheard and smart transitions are hard to achieve, especially if the connection between pollution and health, or even survival, becomes an issue in political discourses. Air pollution, for example, is already today the fourth most reason for death.135
“Pollution is the largest environmental cause of disease and premature death in the world today. Diseases caused by pollution were responsible for an estimated 9 million premature deaths in 2015 – 16 percent of all deaths worldwide – three times more deaths than from AIDS, tuberculosis, and malaria combined and 15 times more than from all wars and other forms of violence. In the most severely affected countries, pollution-related disease is responsible for more than one death in four.”
—The Lancet Commissions, 2017136
In the most severely affected countries, pollution-related diseases are responsible for more than one in four deaths. Pollution disproportionately kills the poor and the vulnerable. These effects are most obvious in low- and middle-income countries, where 92 percent of pollution-related deaths occur. Children, in particular, are most affected by pollution.137
Interests—and the power to push them through—shape politics. Historically, there are several shareholders, each with different risk awareness and focus within the discourse. While industry, generating income and jobs, is politically highly influential, the German example proves that this pyramid of power can be turned upside down if people are aware of the consequences caused by their behaviour. The matter becomes essential and—especially in a democracy—empowers the masses while the influence of the elites diminishes. The Edelman Trust Barometer describes such a tendency: a loss of trust in the elites in nearly all countries.138 In the 2017 report, India was the global leader of trust, but in this year’s report, India belongs to the six countries with the
In other words, the detrimental effects of climate
Price Drops
Reducing pollution and the effects of climate change is in the interest of all stakeholders. Besides ethical issues, pollution is costly for an economy. GDP in low-and middle-income countries decreases annually by up to two percent. Additional healthcare comprises up to seven percent of total healthcare costs in middle-income countries. Welfare losses caused by pollution sum up to US$46 trillion or 6.2 percent of global economic output,140 numbers that tend to grow as more diseases can be linked to pollution over time.
Looking at the energy demand due to economic growth of developing countries, the business opportunities for renewables seem to be significant:
“Powering China and India presents a $4 trillion opportunity. These countries account for 28 percent and 15 percent of all investment in power generation to 2040. Asia Pacific sees almost as much investment as the rest of the world combined, at $4.8 trillion. Of this, just under a third goes to wind, a third to solar, 18 percent to nuclear and 10 percent to coal and gas.”141
Last year, all types of renewable
Figure 19: Global Levelised Cost of Electricity from Utility-Scale Renewable Power Generation Technologies (2010–17)
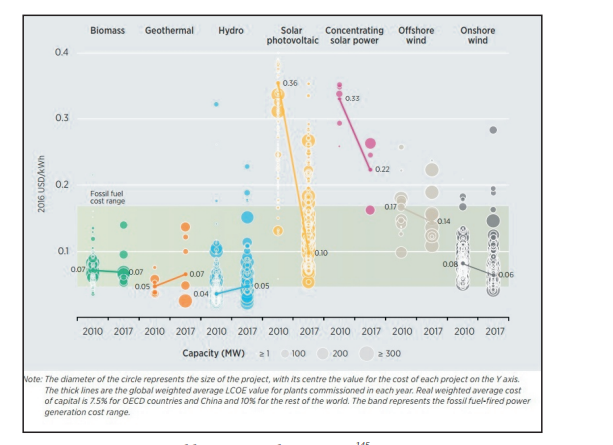
Source: IRENA Renewable Cost Database, 2018.145
A further drop in costs for renewables is to be expected, with all the additional positive economic effects on areas such as health, jobs and development.146 Bloomberg New Energy Finance predicts that the once- costly solar power is becoming so cheap that it will push coal and natural-
The analysts estimate
To understand the German insistence on higher environmental standards, first at the national then at the European and third—together with other European countries—at the global level, it must be acknowledged that the force behind pushing environmental policies has always been an environmentally aware public influencing both politics and industry. In the beginning of Energiewende, critical voices from many politicians, industrialists and business owners were loud and grew over time. Later, the same industry was pushing politicians to achieve a level-playing field for all players in the common market,151 the only way to neutralise cost advantages after the national legislative had set strict national environmental standards. Today, for the same reasons, a joint force of civil society and western industries are pushing for higher environmental standards on a global level.
This push is reinforced by a new industry sector that had entered the political arena and had identified global business opportunities. The green-tech sector is increasingly becoming a driving factor for political decisions in favour of environmental-friendly regulations. Even the “conventional” industry is more sensitive about environmental issues than ever before as efficient technologies offer added value in every sector. During the last decades, Germany, as an export-oriented economy, has progressively been profiting from new, leading green technologies and policies pushing for higher standards. Employment has increased and has helped to keep the unemployment rate the lowest in Germany for the last 25 years.152
In 2013, a study by Roland Berger Consultants measured the global market for green technology of €2.5 trillion and predicted a size of €5.4 trillion by 2025 implying an annual growth rate of 6.5 percent. The percentage of green tech companies in Germany’s GDP would rise from
13 percent (2012) to 20 percent (2025). This trend seems to be
Foundation Monitor 2015154
Summary And Outlook
The long history of Germany’s environmental awareness will not lead future climate policies astray. While at present, Germany is failing to meet the 2020 goals, Energiewende is likely to succeed in the long run. Almost 20 years after the initiation of the energy transition project, the broad support of society is stronger than ever before. And it is expected to grow. Energiewende, once evolved from emotions and morals, has already turned out to be an economic success story with strong rational
1. higher goals for the share of renewables (65 percent) at an earlier stage (2030)
2. better synchronisation between renewables and transmission grids by upgrades and intelligent interfaces (digitalisation)
3. stronger alignment of energy research and development with
Energiewende to
a. alleviate access to economic development schemes for start-ups
b. promote low carbon industry processes and a carbon circular economy
c. accelerate the transition towards a market launch for PtG and PtL
4. advanced coupling of all sectors to generate and use “green” hydrogen
5. elaborate an action plan for an incremental reduction and final exit of coal power (until end of this year) covering social, structural, legal, and economic aspects.
From an outsider’s perspective it may seem impossible that the challenging project Energiewende can be sustained until successful completion. However, though the 2020 goals will quite obviously not be achieved, for Germany it is only a matter of “when” coal power plants will be turned off to reach the goals, not “if.” The German public as well as the European regulation will enforce the exit by higher emission standards and by increasing renewables. Since renewable energy is becoming the cheapest source and storage issues will likely be solved within the next decade, renewables make sense not only from a moral point of view but from an economic one as well.
Despite these positive aspects, Energiewende was neither cheap nor easy to frame. The challenges caused by volatile and unpredictable renewables make it necessary to incrementally move from a base-load towards a residual-load power management. The liberalised power market provides opportunities to share national surplus and supply national demands, but also requires an ongoing update of the grid and cross-border interconnectors at the national borders. So far, Germany’s agencies and grid operators were able to handle the challenge and offered one of the most secure energy supplies worldwide. Germany’s significant power surplus causes not only dropping wholesale power prices but also political tensions as it reduces profits for all European power producers and enforces adjustments of the neighbours’ grids at the same time.
Economic growth, a gift for a society’s welfare, is still a burden for the environment. Germany tries to decouple both and even though it seems
![]() Environmental awareness, as well as knowledge and belief in anthropogenic global warning (AGW), will grow as negative effects of climate change become more obvious. The concurrence of extreme weather events, too, will increase exponentially. As people’s life and health is increasingly affected, industrial production—one foundation for economic wealth and prosperity—will be influenced by public opinion. It will become necessary to decouple production from the negative effects on environment, be it by market regulation or by consumer behaviour. Decision-makers, both in politics and industry, should be prepared for such a development, which has its own logic, strength and dynamic.
Environmental awareness, as well as knowledge and belief in anthropogenic global warning (AGW), will grow as negative effects of climate change become more obvious. The concurrence of extreme weather events, too, will increase exponentially. As people’s life and health is increasingly affected, industrial production—one foundation for economic wealth and prosperity—will be influenced by public opinion. It will become necessary to decouple production from the negative effects on environment, be it by market regulation or by consumer behaviour. Decision-makers, both in politics and industry, should be prepared for such a development, which has its own logic, strength and dynamic.
Endnotes
1. German Federal Ministry for Economic Affairs and Energy, https://www.bmwi.de/Redaktion/DE/Downloads/E/energiekonzept- 2010.pdf? blob=publicationFile&v=3.
2. Florentin Krause, Hartmut Bossel, Karl-Friedrich Müller-Reißmann, “Energie- Wende: Wachstum und Wohlstand ohne Erdöl und Uran (Energy Transition: Growth and Prosperity without Petroleum and Uranium),” (Germany: S Fischer Verlag, 1980), http://www2.hu-berlin.de/sachbuchforschung/CONTENT/ SBDB/pix/PDF/Krause-Energie-Inhalt.pdf.
3. German Federal Ministry for Economic Affairs and Energy, https://www.bmwi.de/Redaktion/DE/Downloads/E/energiekonzept- 2010.pdf? blob=publicationFile&v=3.
4. German Federal Ministry for the Environment, Nature Conservation, Building and Nuclear Safety, "Klimapaket," August 2007, http://www.bmub.bund.de/ fileadmin/bmu-import/files/pdfs/allgemein/application/pdf/klimapaket_ aug2007.pdf; German Federal Ministry for Economic Affairs and Energy, "Fifth Monitoring Report", December 2016, http://www.bmwi.de/Redaktion/EN/ Publikationen/monitoring-report-2016.pdf.
5. German Industry Association (BDI), “Energiesicherheit als Herausforderung der deutschen Außen- und Sicherheitspolitik,” 20 October 2015, https://bdi.eu/artikel/news/energiesicherheit-als-herausforderung-der- deutschen-aussen-und-sicherheitspolitik-eine-perspektive-der-industrie/.
6. Infografik, “Importabhängigkeit der deutschen Energieversorgung,” 2016, https://ag-energiebilanzen.de/index.php?rex_img_type=rex_530&rex_img_ file=ageb_infografik_04_2017_importabhaengigkeit.pdf.
7. Christoph Gunkel, “Atomstrom, ja bitte!” Der Spiegel, 20 June 2011, http://www.spiegel.de/einestages/deutschlands-erstes-akw-atomstrom-ja- bitte-a-947242.html.
8. Urgewald, https://coalexit.org/node/1114.
9. Report, “Investors vs. the Paris Climate Agreement,” Urgewald, 11 December 2017, https://coalexit.org/sites/default/files/download_public/Investors% 20vs.%20Paris_web.pdf.
10. World Nuclear Association, “Plans for New Reactors Worldwide,” September 2017, http://www.world-nuclear.org/information-library/current-and-future- generation/plans-for-new-reactors-worldwide.aspx
12. Patrick Graichen, Frank Peter, Litz Philipp, “Das Klimaschutzziel von -40 Prozent bis 2020: Wo landen wir ohne weitere Maßnahmen?” AGORA Energiewende, 7 September 2017, https://www.agora-energiewende.de/ fileadmin/Projekte/2015/Kohlekonsens/Agora_Analyse_Klimaschutzziel_20 20_07092016.pdf.
13. https://www.cleanenergywire.org/factsheets/germanys-greenhouse-gas- emissions-and-climate-targets.
14. “The perception of Germany’s ‘Energiewende’ in emerging countries,” Konrad- Adenauer-Foundation, 2014, http://www.kas.de/wf/doc/kas_38988-544-2- 30.pdf?150121150722.
15. In addition to other goals, 80–95 percent of consumed energy is generated by renewables.
16. Institute for Advanced Sustainability Studies (IASS), Soziales Nachhaltigkeitsbarometer der Energiewende, 2017, https://www.dynamis- online.de/wp-content/uploads/2017/12/171114-Booklet-Barometer.pdf.
17. Boston Consulting Group, Prognos, “Klimapfade für Deutschland,” January 2018, https://bdi.eu/publikation/news/klimapfade-fuer-deutschland/.
18. Sachverstaendigenrat fuer Umweltfragen, “Wege zur 100% erneuerbaren Stromversorgung,” 26 January 2010, https://www.umweltrat.de/SharedDocs/ Downloads/DE/02_Sondergutachten/2011_Sondergutachten _100Prozent_ Erneuerbare_KurzfassungEntscheid.pdf? blob=publicationFile&v=4.
19. The concept of Nachhaltigkeit (sustainability) was introduced by the German mining administrator and tax accountant Hans Carl von Carlowitz, who published “Silvicultura Oeconomica” and is considered the inventor of the modern term “sustainable” (nachhaltig).
20. 1899: German Society for Nature Conservation; 1906: First state environmental protection office in the State of Prussia; 1919: Environmental protection mentioned in the Weimar Constitution; 1936: Worldwide first environmental protection bill; 1952: Inter-parliamentary working group for an ecological economy; 1957: Federal Water Act; 1962: German Council for Landscape Conservation; 1970: Worldwide first Ministry for Environment (Bavaria).
21. https://www.gruene.de/ueber-uns/35-gruene-jahre-35-gruene-geschichten/ 35-gruene-jahre-1-gruendung-der-gruenen.html.
22. https://www.bundestag.de/dokumente/textarchiv/2013/42884746_kw09_ wahlen_1983_kalenderblatt/210888.
23. http://www.helmut-kohl-kas.de/index.php?msg=885&from=829.
24. While this act guaranteed a minimum price for renewables fed in the grid and limited it to a maximum amount of five percent, both limitations were repealed by the EEG, the successor Bill in 2000. Deutschlandfunk 24 March 2010, http://www.deutschlandfunk.de/das-erneuerbare-energien-gesetz-wird-zehn- jahre-alt.697.de.html?dram:article_id=76941.
25. Dorothee Arlt and Jens Wolling, “Fukushima-Effekte in Deutschland?” Universitätsverlag Ilmenau 2014, 269ff.
26. http://www.bpb.de/politik/grundfragen/parteien-in-deutschland/gruene/ 42151/geschichte.
27. Dorothee Arlt and Jens Wolling, op. cit.
28. https://www.bmwi.de/Redaktion/DE/Downloads/E/energiekonzept- 2010.pdf? blob=publicationFile&v=3.
29. Dorothee Arlt and Jens Wolling, op. cit., 275.
30. Before Fukushima, only four percent of the government camp opposed the extension of the life span of existing nuclear power plants. After Fukushima, the opinion shifted drastically to 75 percent against nuclear power. In: Dorothee Arlt and Jens Wolling, op. cit., 283.
31. https://www.bundesregierung.de/ContentArchiv/DE/Archiv17/Regierungse k l a e r u n g / 2 0 1 1 / 2 0 1 1 - 0 3 - 1 7 m e r k e l - l a g e - j a p a n . h t m l . https://www.bundeskanzlerin.de/ContentArchiv/DE/Archiv17/Mitschrift
/Pressekonferenzen/2011/03/2011-03-14-bkin-lage-japan-atomkraft werke.html.
32. https://www.umweltbundesamt.de/sites/default/files/medien/publikation/ long/2792.pdf.
33. https://www.bmub.bund.de/fileadmin/Daten_BMU/Pools/Broschueren/ umweltbewusstsein _in_d_2014_bf.pdf.
34. https://www.bmub.bund.de/fileadmin/Daten_BMU/Pools/Broschueren/ umweltbewusstsein_ deutschland_2016_bf.pdf.
35. Jeffrey Andersen, “German Unification and the Union of Europe: The Domestic Politics of Integration Policy,” Cambridge University Press 13 June 1999, 85f.
36. Ibid., 87ff.
37. Jun Arima, lead negotiator for Japan’s energy ministry, http://news.bbc.co.uk/ 2/hi/science/nature/7490165.stm.
38. German Federal Ministry for Economic Affairs and Energy; https://www.erneuerbare-energien.de/EE/Redaktion/DE/Dossier/eeg.html? cms_docId=72462.
39. The 2010 Energy Concept heavily relies on the success of the Renewable Energy Act (EEG) established in 2000 and reformed several times since then.
40. http://www.bpb.de/politik/wirtschaft/energiepolitik/152491/standpunkt- das-eeg-ist-eine-erfolgsgeschichte.
41. https://www.bundesnetzagentur.de/SharedDocs/FAQs/DE/Sachgebiete/ Energie/Verbraucher/ Energielexikon/EEGUmlage.html.
42. http://www.bmwi.de/Redaktion/DE/Dossier/energiewende.html.
43. http://www.bmwi.de/Redaktion/EN/Publikationen/gesetzeskarte.pdf?__ blob=publicationFile&v=9.
44. “The Bundesnetzagentur’s core task is to ensure compliance with the Telecommunications Act (TKG), Postal Act (PostG) and Energy Act (EnWG) and their respective ordinances. In this way, it guarantees the liberalisation and deregulation of the markets for telecommunications, post and energy via non- discriminatory network access and efficient system charges. As of 1 January 2006, the Bundesnetzagentur also assumed responsibility for rail regulation. Here, as in the other regulatory areas, it monitors non-discriminatory access to the networks under transparent circumstances, and examines the access c ha rg e s . ” http s : // w w w . b u nd e s ne tz a g e ntu r . d e / E N / G e ne ra l / Bundesnetzagentur/ About/Functions/functions_node.html.
To achieve its regulatory aims, the Bundesnetzagentur has effective procedures and instruments at its disposal, including rights of information and investigation along with the power to impose graded sanctions.
45. https://www.netzentwicklungsplan.de/en.
46. https://ec.europa.eu/energy/en/topics/energy-strategy-and-energy-union/ 2050-energy-strategy.
47. Initiative New Social Market Economy (INSM): “Energiewende kostet 520 Milliarden Euro bis 2025,” 10 October 2016, http://www.insm.de/insm/ Themen/Soziale-Marktwirtschaft/Gesamtkosten-Energiewende.html.
48. Fabian Reetz, “Die Energiewende darf keine Planwirtschaft warden,” in Die Zeit, 10 June 2017, http://www.zeit.de/wirtschaft/2017-06/energiewende-energie- strom-sparen-kosten-verantwortung.
49. https://www.bmwi.de/Redaktion/DE/Publikationen/Energie/hinter grundinformationen-zur-besonderen-ausgleichsregelung-antragsverfahren- 2017.pdf? blob=publicationFile&v=14.
50. https://www.bmwi.de/Redaktion/DE/Downloads/E/eeg-umlage-2017-fakten- und-hintergruende.pdf? blob=publicationFile&v=12.
51. http://www.bmwi-energiewende.de/EWD/Redaktion/Newsletter/2018/ 01/Meldung/direkt-erfasst_infografik.html.
52. http://www.foes.de/themen/energie/stein-und-braunkohle/.
53. Forum Ökologisch-Soziale Marktwirtschaft e.V. (FÖS): “Was der Strom wirklich kostet,” October 2017, http://www.foes.de/pdf/2017-10-Was_Strom_wirklich
_kostet_kurz.pdf.
54. http://www.trendresearch.de/studien/20-01174.pdf?db4978240fad5d7e 503d3f066af70468.
55. Christoph Eisenring, “Das Grauen der deutschen ‘Energiewende’.” Neue Zuericher Zeitung, 9 March 2016, https://www.nzz.ch/wirtschaft/ unternehmen/das-grauen-der-deutschen-energiewende-1.18709484.
56. http://www.bmwi.de/Redaktion/DE/Pressemitteilungen/2018/20180207-eu- kommission-genehmigt-reserve-zur-absicherung-des-strommarktes.html.
57. http://www.bmub.bund.de/fileadmin/Daten_BMU/Download_PDF/ Klimaschutz/klimaschutz_in_zahlen_ emissionsentwicklung_en_bf.pdf.
58. German Federal Environment Agency: “Road transport, whose emissions rose by 3.7 million ton, accounted for the largest share, at 96 percent. The reason for this is that more and more goods are transported by road. Also, the trend towards ever larger and heavier cars remains unbroken,” 23 January 2018, https://www.umweltbundesamt.de/presse/pressemitteilungen/klimagasemis sionen-stiegen-im-jahr-2016-erneut-an.
59. https://www.umweltbundesamt.de/presse/pressemitteilungen/klimagasemi sionen-stiegen-im-jahr-2016-erneut-an.
60. Press Release, Agora Energiewende, 2 May 2017, https://www.agora- energiewende.de/de/presse/pressemitteilungen/detailansicht/news/ein- sonntag-fast-ohne-kohlestrom/News/detail/.
61. Environmental Performance Index, 2016, 18; http://epi.yale.edu/sites/ default/files/2016EPI_Full_Report_opt.pdf.
62. Eurostat: Total greenhouse gas emissions by countries (including international aviation and indirect CO 2 , excluding LULUCF), 1990 – 2015 , http://ec.europa.eu/eurostat/statistics-explained/index.php/File:Total_ greenhouse_gas_emissions_by_countries_(including_international_aviation_ and_indirect_CO2,_excluding_LULUCF),_1990_-_2015_(million_tonnes_of_ CO2_equivalents)_updated.png.
63. German Federal Ministry for Economic Affairs and Energy, https://www.bmwi.de/Redaktion/DE/Dossier/erneuerbare-energien.html.
64. https://www.mckinsey.de/files/140902_pm-ewi_september-2014.pdf.
65. P r o j e k t i o n s b e r i c h t 2 0 1 7 f ü r D e u t s c h l a n d ( 2 0 1 7 ) , p 2 9 ; http://cdr.eionet.europa.eu/de/eu/mmr/art04-13-14_lcds_pams_ projections/projections/envwqc4_g/170426_PB_2017_-_final.pdf.
66. https://www. agora- energiewende. de/fileadmin/Projekte/2015 / Kohlekonsens/Agora_Analyse_Klimaschutzziel_2020_07092016.pdf.
67. https://www.destatis.de/DE/Publikationen/Thematisch/Volkswirtschaftlich Gesamtrechnungen/Inland sprodukt/InlandsproduktsberechnungLange ReihenPDF_2180150.pdf? blob=publicationFile.
68. https://www.umweltbundesamt.de/daten/klima/treibhausgas-emissionen-in- deutschland#textpart-3.
69. https://www.greenpeace.de/sites/www.greenpeace.de/files/publications/ 20170628-greenpeace-studie-klimaschutz-kohleausstieg.pdf.
70. https://www.umweltbundesamt.de/sites/default/files/medien/1410/ publikationen/171207_uba_hg_ braunsteinkohle_bf.pdf.
71. Ibid.
72. https://www.bmwi.de/Redaktion/DE/Artikel/Energie/kohlepolitik.html.
73. Ibid.
74. https://www.bundestag.de/blob/505892/0a3577d00633e51547e8b148f2 d58e01/wd-5-033-17-pdf-data.pdf
75. https://www.umweltbundesamt.de/sites/default/files/medien/1410/ publikationen/2017-05-22_climate-change_15-2017_strommix.pdf.
76. Claus Hecking and Stefan Schultz, “Deutschland hat nur noch 20.000 Braunkohle-Jobs,” Der Spiegel 5 July 2017, http://www.spiegel.de/wirtschaft/ unternehmen/braunkohlewirtschaft-bietet-nur-noch-20-000-arbeitsplaetze- a-1155782.html.
77. https://www.umweltbundesamt.de/sites/default/files/medien/1410/ publikationen/171207_uba_hg_ braunsteinkohle_bf.pdf
78. https://www.umweltbundesamt.de/sites/default/files/medien/384/bilder/ 2_abb_kraftwerksleistung-konv-et_2017-02-17.png.
79. Claus Hecking and Stefan Schultz, op. cit.
80. A very common practice of national politics: As the public discourse is hereby prevented, the EU is perceived as an non-transparent and undemocratic institution, and may be one reason for the undermined public support for the EU. [Author’s comment]
81. “Deutschland akzeptiert strenge EU-Klimaauflagen,” Die Zeit, 11 November 2017. http://www.zeit.de/politik/deutschland/2017-11/braunkohle- deutschland-eu-auflagen-klage-verzicht.
82. Institute for Energy Economics and Financial Analysis (IEEFA), “Europe’s Coal- Fired Power Plants: Rough Times Ahead,” May 2017, http://ieefa.org/wp- content/uploads/2017/05/Europe-Coal-Fired-Plants_Rough-Times- Ahead_May-2017.pdf.
83. Brainpool Energy, “Klimaschutz durch Kohleausstieg,” June 2017, https://www.greenpeace.de/sites/www.greenpeace.de/files/publications/201 70628-greenpeace-studie-klimaschutz-kohleausstieg.pdf.
84. https://www.netzausbau.de/bedarfsermittlung/2024/nep-ub/de.html.
85. https://www.netzausbau.de/SharedDocs/FAQs/DE/Allgemeines/05_ Kosten.html.
86. https://www.nationalgeographic.com/magazine/2015/11/germany- renewable-energy-revolution/.
87. RWTH Aachen University, “Leistungsfluesse und Netzauslastung im europaeischen Uebertragungsnetz bis 2050,” Abschlussbericht, http://www.bmub.bund.de/fileadmin/Daten_BMU/Pools/Forschungsdatenb ank/fkz_um_11_41_130_energieinfrastruktur_europa_bf.pdf.
88. Tagesschau: „Rekordkosten für Noteingriffe ins Stromnetz,” 1 January 2018, https://www.tagesschau.de/wirtschaft/tennet-stromnetz-101.html.
89. https://www.bundesnetzagentur.de/DE/Sachgebiete/ElektrizitaetundGas/ Unternehmen_Institutionen/ Versorgungssicherheit/Versorgungsunter brechungen/Auswertung_Strom/Versorgungsunterbrech_Strom_node.html.
90. https://www. agora- energiewende. de/fileadmin/Projekte/2015 / Understanding_the_EW/Agora_Understanding_the_Energiewende.pdf.
91. Fraunhofer Institut für Windenergie und Energiesystemtechnik (IWES), “Systemkonflikt in der Transformation der Stromversorgung,” Expertise, December 2010, https://www.umweltrat.de/SharedDocs/Downloads/DE/ 03_Materialien/2011_MAT44_Systemkonflikt_Transformation_Stromversor gung.pdf? blob=publicationFile&v=8.
92. Sachverständigenrat für Umweltfragen (SRU), “10 Thesen zur Zukunft der Kohle bis 2040,” Kommentar, 19 June 2015, https://www.umweltrat.de/ SharedDocs/Downloads/DE/05_Kommentare/2012_2016/2015_06_KzU_14
_10_Thesen_Zukunft_Kohle.pdf? blob=publicationFile&v=6.
93. Currently, smart-meter technology is facing a lack of supply and trust. High security standards became necessary after several privacy breaches in the past. This slows down market availability and certification process. Wolfangel, Eva, “Sorge um Sicherheit von smarten Stromzählern,” Sueddeutsche Zeitung, 25 August 2017), http://www.sueddeutsche.de/wissen/smart-home-sorge-um- sicherheit-von-smarten-stromzaehlern-1.3637580.
94. https://www.dvgw.de/themen/gas-und-energiewende/sektorenkopplung/.
95. Impulspapier Sektorenkopplung – Energiewende neu denken, DVGW Deutscher Verein des Gasund Wasserfaches e.V., 27 September 2016, https://www.dvgw.de/medien/dvgw/verein/energiewende/dvgw- impulspapier-sektorenkopplung.pdf.
96. https://www.dvgw.de/english-pages/topics/gas-and-energy-transition/ integrated-energy/.
97. http://www.bhkw-jetzt.de/home-warum-bhkws/strom-zu-ee-gas/.
98. https://www.dvgw.de/medien/dvgw/verein/energiewende/bilder/karte- power-to-gas-anlagen.pdf
99. https://www.dvgw.de/themen/gas-und-energiewende/power-to-gas/.
100. See chapter 3.c. for the current situation on the emission certificates.
101. Federal Ministry for the Environment, Nature Conservation, Building and Nuclear Safety http://www.bmub.bund.de/themen/atomenergie- strahlenschutz/nukleare-sicherheit/aufsicht-ueber-kernkraftwerke/ kernkraftwerke-in-deutschland/.
102. Matthias Heddenhausen, “Privatisations in Europe’s liberalized electricity markets,” Stiftung fuer Wissenschaft und Politik, December 2007,
https://www.swp-berlin.org/fileadmin/contents/products/projekt_ papiere/Electricity_paper_KS_IIformatiert.pdf.
103. https://www.energy-charts.de/exchange_de.htm.
104. Christian Schlesiger, “Braunkohleausstieg - Der Mythos vom drohenden Blackout,” in Wirtschaftswoche, 13 November 2017, http://www.wiwo.de/ politik/deutschland/braunkohleausstieg-der-mythos-vom-drohenden- blackout/20568858.html.
105. Energy generated by gas power plants is more expensive for operators than any other source of energy.
106. Christian Schlesiger, op. cit.
107. Diana Schumann, “Die Bedeutung politikfelduebergreifender Koppelgeschaefte fuer die Europaeische Energiewirtschaft,” Diskussionspapiere au der Fakultaet fuer Soialwissenschaft Ruhr-Universitaet Bochum, March 2001, https://www.sowi.rub.de/mam/content/fakultaet/diskuss/dp01-2.pdf.
108. United Nations Climate Change/COP 23, https://cop23.unfccc.int/news/more- than-20-countries-launch-global-alliance-to-phase-out-coal.
109. Julia Schilly, “Merkel nennt in Bonn kein Datum für Kohleausstieg,” in Der Standard, 15 November 2017, derstandard.at/2000067886452/Merkel- nennt-in-Bonn-kein-Datum-fuer-Kohleausstieghttp://derstandard.at/ 2000067886452/Merkel-nennt-in-Bonn-kein-Datum-fuer-Kohleausstieg.
110. World Nuclear Association; http://www.world-nuclear.org/information- library/country-profiles/countries-a-f/france.aspx.
111. http://www.faz.net/aktuell/wirtschaft/weltklimakonferenz-20-staaten- verkuenden-abkehr-von-der-kohle-15295320.html; 16 November 2017.
112. Government of the United Kingdom, https://www.gov.uk/government/ uploads/system/uploads/attachment_data/file/660041/powering-past-coal- alliance.pdf.
113. https://www.iea.org/publications/freepublications/publication/GlobalGas SecurityReview2016.pdf, 97.
114. https://www.iea.org/publications/freepublications/publication/GlobalGas SecurityReview2016.pdf; 81.
115. German Federal Ministry for Economic Affairs and Energy, https://www.bmwi.de/Redaktion/DE/Infografiken/Energie/woher-kommen- die-deutschen-rohoelimporte.html.
116. https://www.iea.org/publications/freepublications/publication/GlobalGas SecurityReview2016.pdf.
117. Interview with Claudia Kemfert, Head of the Department of Energy, Transport and Environment at the German Institute for Economic Research (DIW), in “Deutschlands Abhaenhigkeit - Es gibt noch keine Alternative zu russischem Gas,” Handlesblatt, 12 March 2014, http://www.handelsblatt.com/ politik/international/deutschlands-abhaengigkeit-es-gibt-noch-keine- alternative-zu-russischem-gas/9605486.html.
118. Benjamin Bidder, “Worum es im Gasstreit wirklich geht,” Der Spiegel, 17 June 2017; http://www.spiegel.de/wirtschaft/unternehmen/russland-was-steckt- hinter-dem-gas-streit-a-1152643.html
119. “CDU foreign expert Elmar Brok told the ‘Bild’ newspaper, it was ‘a scandal that a former Chancellor now represents the interests of Putin’. ‘And it’s amazing that this has so far remained without consequences in the public debate.’ Green MP Cem Özdemir also criticized that Schröder ‘mutated into Putin’s propagandist’ and said: ‘Who books Schröder, must know that he gets a Putin mouthpiece.’ In:”Ukraine for sanctions against former chancellor Schröder”, FAZ, 19 March 2018, http://www.faz.net/aktuell/wirtschaft/mehr- wirtschaft/kiews-aussenminister-sanktionen-gegen-altkanzler-schroeder- pruefen-15501118.html
120. Christina Hebel, “Schroeders neue Welt,” Der Spiegel, 29 September 2017, http://www.spiegel.de/wirtschaft/unternehmen/gerhard-schroeder-im- rosneft-aufsichtsrat-wladimir-putins-bester-mann-a-1170444.html.
121. Reuters, 12 August 2017, https://www.reuters.com/article/us-russia-rosneft- board/russia-nominates-german-ex-chancellor-schroeder-to-rosneft-board- idUSKBN1AS0FS.
122. Benjamin Bidder, “Worum es im Gasstreit wirklich geht,” Der Spiegel, 17 June 2017, http://www.spiegel.de/wirtschaft/unternehmen/russland-was-steckt- hinter-dem-gas-streit-a-1152643.html.
123. https://www.bloomberg.com/news/articles/2017-07-03/german-addiction- to-russia-gas-raises-alarm-in-merkel-s-backyard
124. Global Gas Security Review 2016, 75, https://www.iea.org/publications/ freepublications/publication/GlobalGasSecurityReview2016.pdf.
125. Official title of the carbon credits or pollution permits traded in EU ETS (includes the equivalent amount of more powerful greenhouse gases).
126. European Environment Agency, EEA Report No. 18/2017, “The EU Emissions Trading System in numbers,” 7 November 2017, https://www.eea.europa.eu/ publications/trends-and-projections-EU-ETS-2017/at_download/file.
127. “The EPA is rewriting the most important number in climate economics,” The Economist, 16 November 2017, https://www.economist.com/news/united- states/21731395-reducing-social-cost-carbon-would-allow-epa-dispense- regulations-epa.
128. Nina Heikkinen, “EPA Revises the Social Cost of a Potent Greenhouse Gas,” Scientific American, 20 November 2017, https://www.scientificamerican.com/ article/epa-revises-the-social-cost-of-a-potent-greenhouse-gas/.
129. “Effective Carbon Rates - Pricing CO2 through Taxes and Emissions Trading Systems,” OECD, 26 September 2016, http://dx.doi.org/10.1787/ 9789264260115-en.
130. Portugal, Ireland, Italy, Greece and Spain.
131. Federal Bureau of Statistics, “Deutscher Aussenhandel Export und Import im Zeichen der Globalisierung,” 2017, 7, https://www.destatis.de/DE/ Publikationen/Thematisch/Aussenhandel/Gesamtentwicklung/Aussenhandel Welthandel5510006159004.pdf? blob=publicationFile.
132. Council of the European Union, Reform of the EU emissions trading scheme, 14 November 2017, http://www.consilium.europa.eu/en/policies/climate- change/reform-eu-ets/#.
133. http://www.pbl.nl/en/publications/trends-in-global-co2-and-total- greenhouse-gas-emissions-2017-report.
134. Sven N. Willner, Anders Levermann, Fang Zhao and Katja Frieler, “Adaptation required to preserve future high-end river flood risk at present levels,” Science Advances, 10 January 2018, http://advances.sciencemag.org/content/ 4/1/eaao1914.full.
135. This development can be expected in 26 of India’s 36 states and union territories, three of which exceed 1M people. http://documents.worldbank.org/ curated/en/781521473177013155/pdf/108141-REVISED-Cost-of-Pollution WebCORRECTEDfile.pdf.
136. The Lancet Commission on pollution and health, 19 October 2017, 462, http://www.thelancet.com/pdfs/journals/lancet/PIIS0140-6736(17)32345- 0.pdf.
137. Ibid.
138. 2017 Edelmann Trust Barometer, Executive Summary, 10 , https://www.edelmanergo.com/fileadmin/user_upload/Studien/2017_Edelm an_Trust_Barometer_Executive_Summary.pdf.
139. 2018 Edelmann Trust Barometer, Global Report, 8, http://cms.edelman.com/ sites/default/files/2018-01/2018_Edelman_Trust_Barometer_Global_ Report_Jan.PDF.
140. The Lancet Commission on pollution and health, 19 October 2017), 462, http://www.thelancet.com/pdfs/journals/lancet/PIIS0140-6736(17)32345- 0.pdf.
141. Bloomberg New Energy Finance, “New Energy Outlook 2017,” 15 June 2017, 2
142. BP Global, https://www.bp.com/en/global/corporate/energy-economics/ statistical-review-of-world-energy/coal/coal-production.html.
143. Chandra Bushan, “The End of Coal,” in Down to Earth, 16–31 October 2017, 27ff.
144. Executive Summary, Renewable Power Generation Costs in 2017, January 2018, https://www.irena.org/-/media/Files/IRENA/Agency/Publication/ 2018/Jan/IRENA_2017_Power_Costs_2018_summary.pdf?la=en&hash=6A7 4B8D3F7931DEF00AB88BD3B339CAE180D11C3.
145. IRENA, “Renewable Power Generation Costs in 2017,” January 2018, www.irena.org RENEWABLE POWER GENERATION COSTS IN 2017 KEY FINDINGS AND EXECUTIVE SUMMARY https://www.irena.org/-
/media/Files/IRENA/Agency/Publication/2018/Jan/IRENA_2017_Power_Co sts_2018_summary.pdf?la=en&hash=6A74B8D3F7931DEF00AB88BD3B339 CAE180D11C3.
146. New Energy Outlook, 2017, https://about.bnef.com/blog/investing-trillions- electricitys-sunny-future/.
147. Bloomberg New Energy Finance, https://about.bnef.com/blog/bnefs- bhavnagri-renewables-outcompeting-coal-cost/.
148. Bloomberg New Energy Finance, “New Energy Outlook 2017,” 15 June 2017, 2.
149. Bloomberg New Energy Finance, “Runaway 53GW Solar Boom in China Pushed Global Clean Energy Investment Ahead in 2017,” 16 January 2018), https://about.bnef.com/blog/runaway-53gw-solar-boom-in-china-pushed- global-clean-energy-investment-ahead-in-2017/.
150. Ibid.
151. Jeffrey Andersen, “German Unification and the Union of Europe: The Domestic Politics of Integration Policy,” Cambridge University Press, 13 June 1999, 94.
152. http://www.handelsblatt.com/politik/konjunktur/nachrichten/konjunktur- in-deutschland-arbeitslosenzahl-so-niedrig-wie-seit-25-jahren-nicht/ 14780840.html; 02.11.2016.
153. Green Economy Gründungsmonitor, 2014, https://www.borderstep.de/wp- content/uploads/2014/12/2014_Gru%CC%88ndungsmonitor_web-high.pdf.
154. Green Economy Gründungsmonitor, 2015, https://www.borderstep.de/wp- content/uploads/2016/09/Gr%C3%BCndungsmonitor-2015.pdf.
155. http://www.csu.de/common/csu/content/csu/hauptnavigation/dokumente/ 2018/Koalitionsvertrag_ 2018.pdf.
The views expressed above belong to the author(s). ORF research and analyses now available on Telegram! Click here to access our curated content — blogs, longforms and interviews.

Christoph K. Klunker was a Senior Fellow with ORF's Climate, Energy and Resources programme. His research focuses primarily on circular (closed-loop) economy and renewable energy ...
Read More +