Introduction
At present, the burning concern driving forward reflection on the crisis in Ukraine revolves around solving the somewhat deadlocked situation between the revived 'Cold War' frontlines of the West (nowadays geographically and politically enlarged) and the East (smaller today and concentrated more than ever on Russia). And not to forget, of course, the dramatic internal political situation facing the sovereign state of Ukraine.
How should the world react; what can and should the Western world do in reaction to Russia's annexation of Crimea, which has been widely condemned as a harsh infringement of international law? While military action has been broadly ruled out, the foremost goal should be to bring all engaged parties back to the table and to try and find a diplomatic solution. However, to increase the pressure some sanctions have already been imposed, a tightening and escalation towards more severe economic sanctions is in the pipeline: Indeed, one of the options is to hit one of Russia's most crucial economic lifelines: gas and oil exports.
To bring the scope of economic sanctions more into focus, this paper seeks to highlight some crucial information and data by spotlighting the current foreign trade relations of Russia with Europe and Germany (representative as Europe's largest and most important economy), respectively, as well as investigating the impact of a probable reduction of natural gas supply from Russia. The US, in all likelihood, will enhance
Economic Relations between Europe and Russia
The extent of economic relations between Europe and Russia is considerable and very far-reaching. On the one hand, this raises substantial hopes that economic sanctions or their threat against Russia can indeed be helpful. But on the other hand, this raises the risk that economic sanctions against Russia might turn out to be too painful for the European economy.
Broadly one can state that Russia is the third largest trading partner of the EU and the EU is by far the largest trading partner for Russia. The most current official Eurostat data set reveals that Russia is both among the three most important exporters and importers together with the US and China (Figure 1 ).
Figure 1: Main G20 Trading Partners for EU-27 Exports and Imports of Goods (2011)
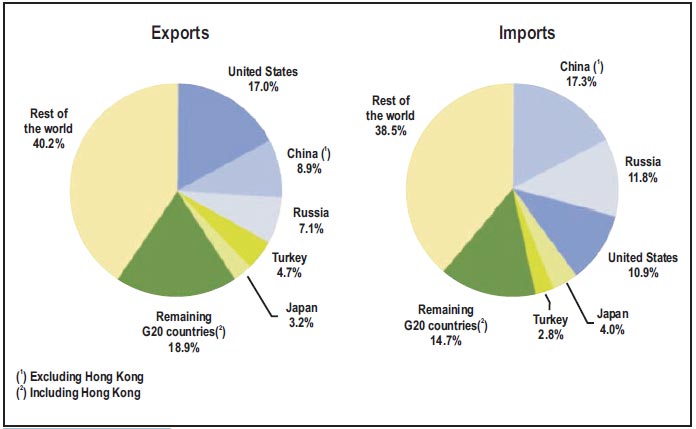
Source: Eurostat (2014).
Cross-border trade of goods between EU-27 and Russia reached record values in 2012. After a deep plunge in 2009, exports to as well as imports from Russia have almost doubled from then till 2012, reaching an export value of 123 billion (bn) Euro and import value of 213 bn Euro (Figure 2). The hefty trade deficit of about 90 bn Euro to the disadvantage of the EU is mainly due to the massive energy imports from Russia. According to EIA (2014) European countries imported 84 percent of Russia's oil exports and roughly 76 percent of its natural gas exports.1 Exports from Europe to Russia are dominated by industrial goods – machinery and transport as well as manufactured goods.2
Figure 2: EU-Russia Trade Relation (Goods, 2012)
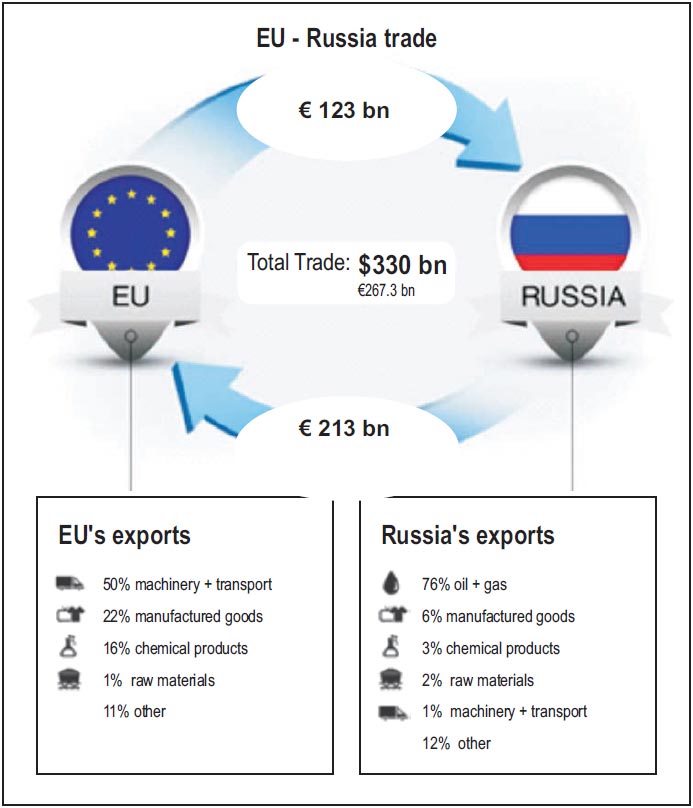
Source: Rosstat, Eurostat. Taken from RT (2014a), own amendments.
Compared with the EU, the value of trade relations between the US and Russia is only a fraction (far less than a tenth). Thus the political leverage of the US with respect to imposing economic sanctions against Russia will be comparatively limited.
Since Russia is a substantial producer and exporter of oil and natural gas, it cannot be stressed enough how much its economy depends on these energy exports: Russia's economic growth continues to be driven by energy exports, given its high oil and gas production and the elevated prices for these commodities. Oil and gas revenues accounted for 52 percent of federal budget revenues and over 70 percent of total exports in 2012 according to PFC Energy.3
In Europe, Germany is leading the pack. In 2012, almost one-third (38 bn Euro) of total EU exports to Russia can be attributed to Germany, then about 8 percent to Italy and 7 percent to France. Looking at imports, Germany's share is not that impressive: almost one-fifth of all imports went into Germany, followed by the Netherlands (14 percent), Poland (10 percent) and Italy (9 percent). 4
However, looking at Russia's trade (figures 3), it becomes very clear that Russia is far more vulnerable from trading sanctions than Europe is, since the EU ranks as Russia's number one trading partner (total trade value 267.5 bn Euro). Russia's trade linkages with EU countries exceed those with the second-ranked China by more than four times. Ukraine is ranked third. Trading relations with the US are significantly smaller than even between Russia and Belarus.
Figure 3: Russia's Top Trading Partners (2012)
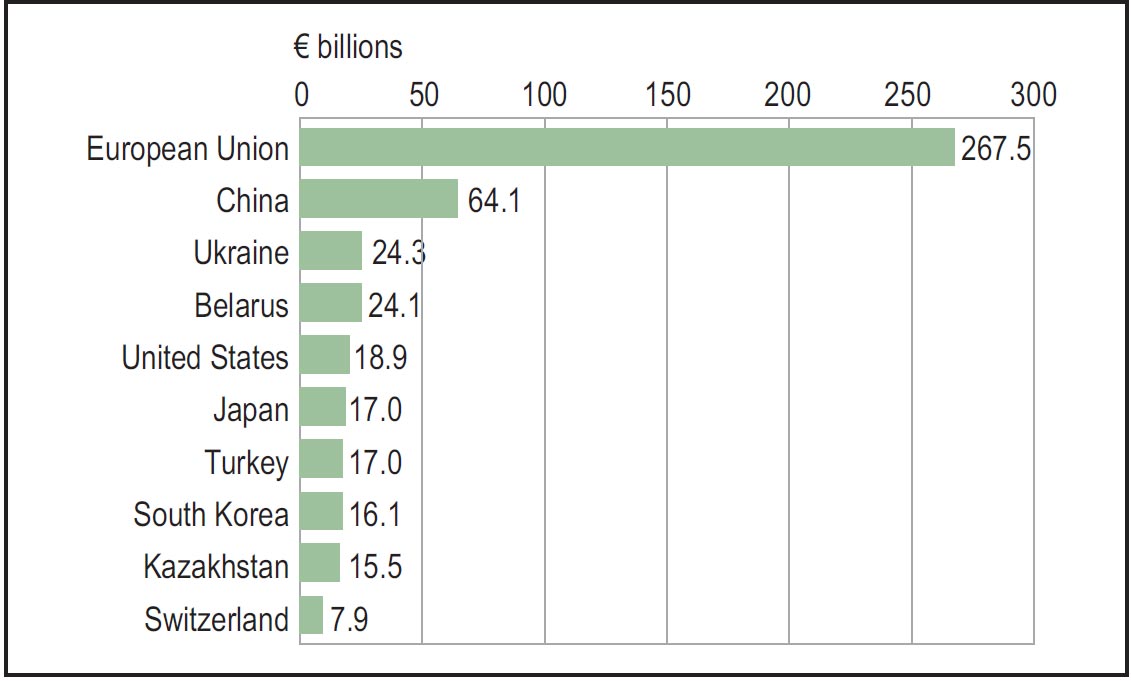
Source: Eurostat. Taken from BBC (2014).
The data clearly demonstrates that Germany is set to play a significant role not only because of its intensive trade relations with Russia, but also because exposure and risk to the German – and thus most of the European – economy seems to be unprecedentedly high. Therefore, Germany will most probably have to pay dearly for an economic war.5
Economic Relations between Germany and Russia
German companies that are engaged in Russia are set to foot a large part of the bill if strict economic sanctions are implemented. According to information from DER SPIEGEL (2014c), only the turnover of the DAX-listed corporations in Russia was more than 20 bn Euro in 2012. The average share of their business in Russia is about 7.5 percent of the total groups' turnover. For some companies that are not listed in the DAX, the dependence on Russia might be even higher. For instance, the share of business in Russia is about 20 percent for the Knauf Group.
According to Der Spiegel (2014a), more than 6,000 German companies with more than 120,000 working staff are engaged in Russia, and more than 300,000 jobs in Germany depend on trading relations with Russia.
As the overview in (figure 4) highlights, some of the largest German companies cover a broad range of business in Russia, e.g.:
- SIEMENS in railway, power generation, medical technology,
- joint-venture with the Sinara Group
- E.ON in gas and coal-fired power generation
- ALLIANZ in insurances
- METRO in cash & carry markets
- VW car production plant in Kaluga
The turnover of German machine manufacturers in Russia reached almost 10 bn Euro in 2013 while the German chemical industry has a turnover of about 4.5 bn Euro.
Figure 4: Business of Selected German Companies and Manufacturing Sectors in Russia (2013)
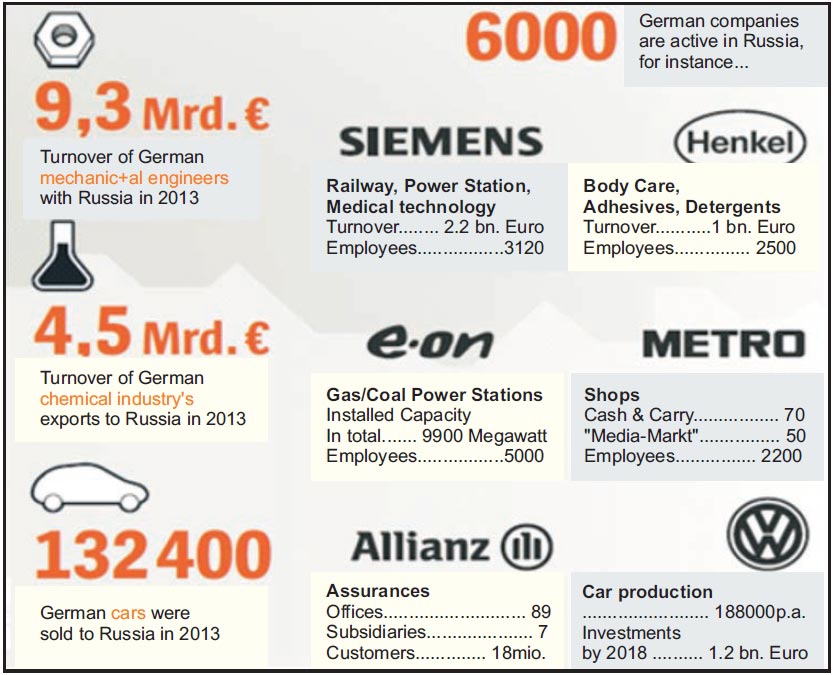
Source: DER SPIEGEL (2014a). Translated by author
DER SPIEGEL (2014b) recently cited a study of consultancy heavyweight KPMG which stated that already a high number of German companies are beating a hasty retreat by withdrawing their money. Up till now, German companies have been one of the largest contributors of FDI in Russia, with investments of over 20 bn Euro.
In the light of these strong economic ties between German companies and Russia, some harsh opposition from the German industry against imposing sanctions on Russia can be expected. Admittedly, this will not enhance the pro- economic sanctions political decision-making process. On the other hand, the German economy has performed quite well even in overall unfavourable market conditions. According to the German think tank DIW (2014), the German economy has seen a significant burst of growth in the first quarter of 2014 (+0.7 percent GDP). Furthermore, the so-called 'Wirtschaftsweisen', a German expert council for the assessment of macroeconomic development,6 has likewise pointed out a fairly robust economic development in the country since they have raised their expectations of German GDP growth significantly at the end of March. In a nutshell, there will be strong opposition to unwanted and painful measures, but given the robustness of the German economy and industry, some sanctions against Russia could be withstood without too much hardship.
Nevertheless, since this robustness is not visible in other parts of Europe, some states will have to suffer more from probable sanctions, and according to the extent of their individual economic ties with Russia. For instance, since Italy's economic development has been crippled over the years and about 8 percent of all European exports to Russia are Italian in origin, Italy might have to shoulder a heavier burden of sanctions.
Is Natural Gas Suited as the Appropriate Economic Weapon Against Russia?
The strategic option of boycotting natural gas imports from Russia, or at least its gradual and/or temporary reduction, has been broadly discussed in European and German political as well as economic circles. According to Financial Times (2014a), the European Commission is drawing up options for “reducing energy dependence on Russia”, as part of a second possible package of sanctions. But in Germany, even the leaders of the ruling grand coalition are not singing the same hymn. While Chancellor Merkel, in her statement, favoured a reduction of Russian energy resources, the leader of the coalition partner SPD, Mr. Gabriel, stated that there is no reasonable alternative to natural gas imports from Russia.7
The discussion is rather controversial in the energy scene, challenging both the ability and the willingness on the part of European countries to impose sanctions on Russia. Some perceptions in the recent past are illustrative:
Guenter Oettinger, the current Commissioner for Energy at the European Union: “No need to worry [about gas]. [...] We have grown much less dependent than ever before.” (DW (2014b)).
"There's a glut on the international gas markets," believes Claudia Kemfert, an energy expert with the German Institute for Economic Research (DIW). But Kemfert said that in the long run, Europe is insufficiently prepared to purchase a third of the gas it needs elsewhere. "That is true in particular for countries in Southeast Europe that buy large amounts of gas in Russia." (DW (2014a)).
The consultant Energy Comment (2014) thinks that the Kremlin would be hardly hit by a boycott, and could withstand it by yielding profits from other commodities. The EU, however, would have little choice, because it would barely be able to cover its gas needs from other sources. They therefore conclude that President Putin has the upper hand in this power play.
Importance of European Gas Imports for Russia
Russia's oil and gas economy is all about superlatives: Russia is one of the top three crude oil producers in the world and the second largest exporter of oil products. Furthermore, Russia is the second largest gas producer in the world and is considered to have the largest proven reserves of (conventional) gas. Its economy largely depends on energy production and exports.
Overall, oil and gas revenues accounted for 52 percent of federal budget revenues and over 70 percent of total exports in 2012.8 Europe accounts for about half of Gazprom's gas revenues and about two-thirds of Russia's crude oil exports.9 According to the German consultancy Energy Comment (2014), net export earnings of crude oil (and products) reached a record high of almost US$ 300 bn in 2012 in addition to gas earnings of roughly US$ 70 bn (Figure 5). In light of these numbers, the enforcement of effective sanctions and gas import boycotts should give Russia a real scare, at least if the threat is regarded as credible.
Figure 5: Russia Earnings from Oil and Gas Exports (2002-12)
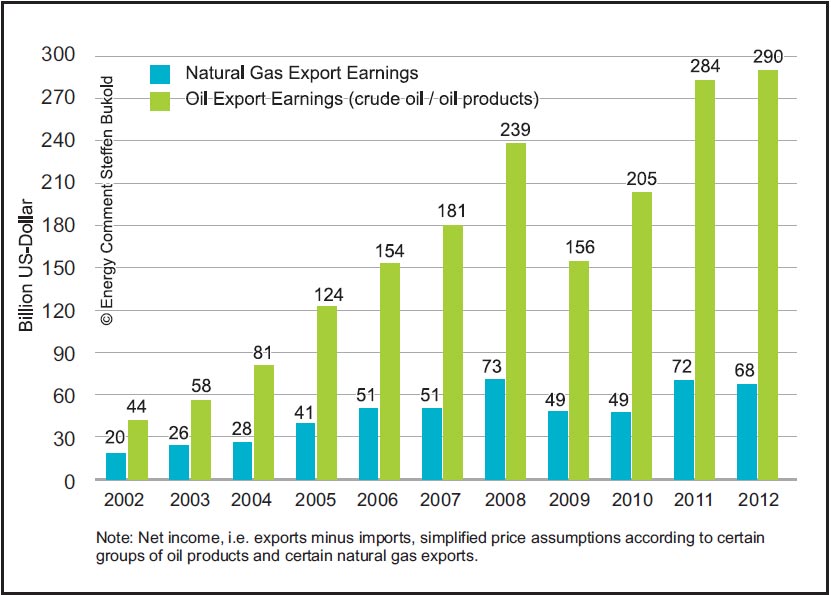
Source: EnergyComment (2014); based on following data sources: EIA, IEA, Platts, Global Energy Briefing. Translated by author.
Importance of Russian Gas Exports for Europe
The EU's dependency on energy imports is of outstanding concern and is one of the most important and longstanding policy topics on national as well as supranational level, particularly in the aftermath of the Russian- Ukrainian gas crisis in January 2009. In 2010, more than half of the EU- 27's gross inland energy consumption was imported. Except for renewable energy sources (REN), production of all other energy types is heading south, thus calling for an increasing fraction of energy imports (figure 6). Only Denmark comes up with a negative dependency rate among the member states in 2010.10
Figure 6: Energy Dependency Rate - all Products (2010)
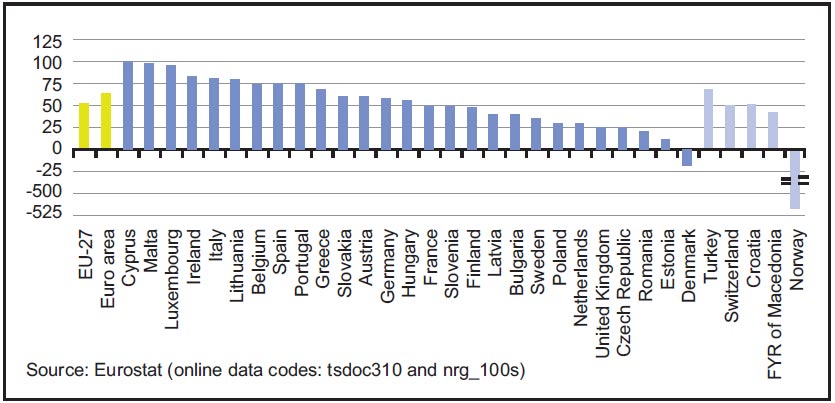
Source: Eurostat (2014b).
Russia is by far the leading supplier of crude oil, natural gas as well as hard coal. For instance, in 2010, more than one-third of total EU-27's crude oil imports were from Russia. Russia became the principal supplier of hard coal in 2006, overtaking South Africa, Australia and Colombia (share of 27 percent in 2010).11
In 2013, total gas demand in EU-28 was about 460 billion cubic metres (bcm). Indigenous production still remained the largest source of gas for EU-28 customers, making up one-third of the total net supplies. The main import sources of supply were Russia (27 percent), Norway (23 percent) and Algeria (8 percent). LNG flows to the EU were again challenged in 2013 by strong competition on the global market. The share of gas from Qatar, Europe's main LNG supplier, decreased from 6 percent in 2012 to 4 percent in 2013.12 Figure 7 provides a snapshot of EU gas imports for the period 2011-12. (Note that even if figure 7 shows a setback in 2012, the share of gas from Russia has steadily increased throughout the recent years, gaining back shares from LNG.)
Figure 7: Share of EU-28 Natural Gas Suppliers (2011, 2012; in Percent)
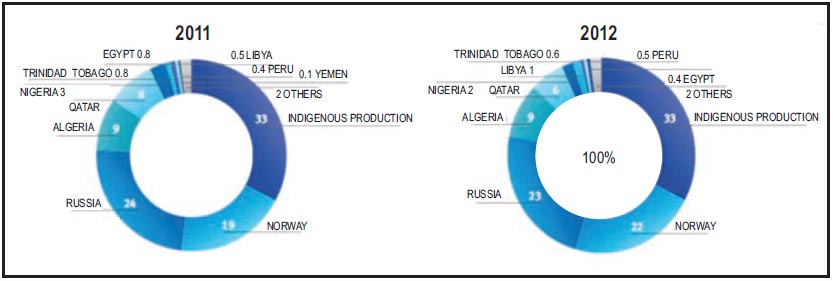
Source: Eurogas (2014).
About one quarter of total natural gas supplies to Europe are currently sourced from Russia, a decrease from 45 percent in 2003 mainly due to rising LNG shares squeezing out pipeline supplies. The extent of dependency on Russia varies significantly (Figure 8). Yet, to break with the 'addiction' is a feat to undertake given that a record high of 162 bcm of Russia's gas exports to Europe was reported for 2013 and the most recent data even highlights another increase of 2.4 percent in the first quarter of 2014. Exports to Great Britain surged by more than 30 percent, while Germany boosted its imports by a remarkable 15 percent.13
Figure 8: EU's Energy Dependency Rate – Natural Gas from Russia (2012)
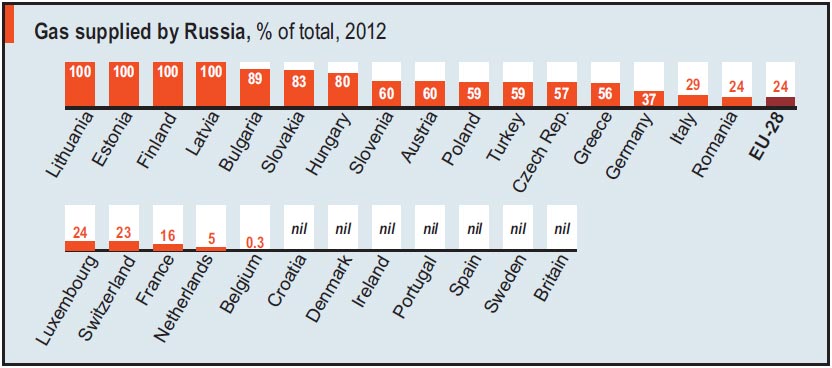
Source: Eurostat (2014b).
Germany's import share is far above the European average as recent statistics from AGEB (2014b) demonstrate. The total import quota was 71 percent in 2013, of which almost one quarter was imported from Russia (across all energy sources). As shown in figure 9, the leading imported energy product from Russia was natural gas (38 percent) followed by oil (34 percent) and hard coal (23 percent). The overall value of net energy imports by Germany amounted to about 100 bn Euro in 2013. Of this, roughly one-third were due to Russia.
Figure 9: Energy Import Quota for Germany (2013)
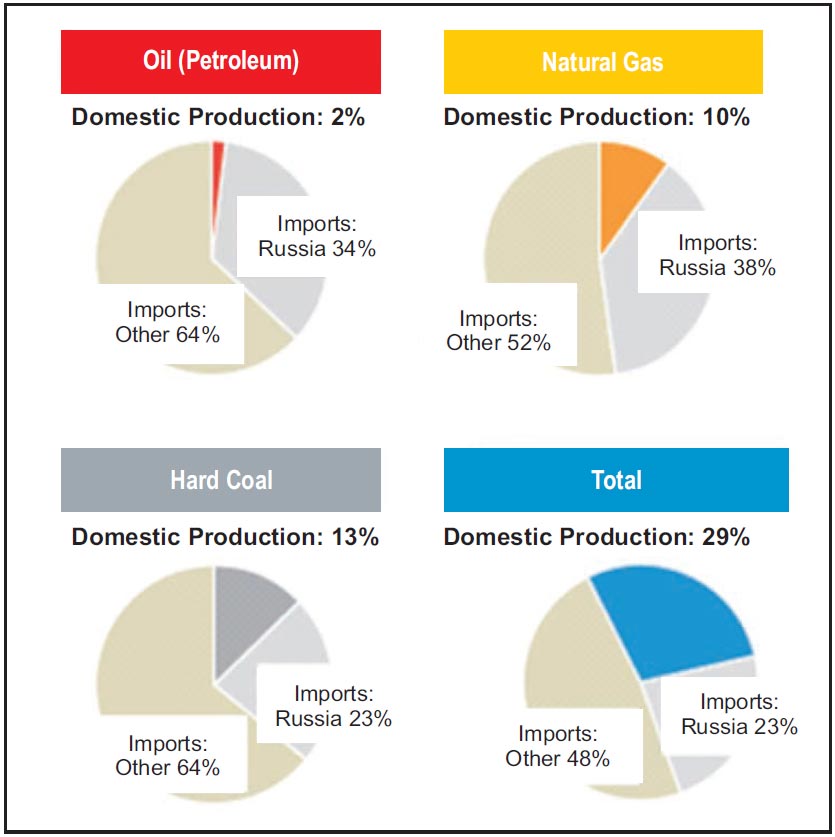
Source: AGEB (2014b). Compiled and translated by author.
Role of Ukraine – the Gateway to Europe
About half of the European gas imports from Russia, or 16 percent of overall European gas consumption, cut across Ukraine in 2013 using the two major pipeline systems (Figure 10): Brotherhood and Soyuz. Gas from Russia also flowed through Ukraine via the Trans-Balkan pipeline towards the Balkans and Turkey.14
Previously, Russian dependency on transits through Ukraine was even higher, with about four-fifth of all its gas exports to Europe transiting Ukraine. However, the Russians have tackled this vulnerability by forking out huge sums of money into alternatives bypassing the revolutionary and increasingly “faithless” transit country. The new connections can partly be considered as strategic overcapacities:
The Nord Stream pipeline, a 1224-km long sub-sea twin pipeline link between Russia and Germany passing through the Baltic Sea, was completed end of 2012 with a total combined capacity of 55 bcm per annum (bcm/a). With an investment of over 10 bn Euro it includes related onshore, feeder and distribution transportation systems.
The South Stream pipeline is designed for transporting natural gas from Russia under the Black Sea to Bulgaria, crossing through Turkey's waters, hence avoiding Ukraine's territory altogether. Construction of the 900-km trunkline began in December 2012, and the first gas supplies are scheduled for late 2015. The capacity is designed to reach 63 bcm/a. The costs of the “Southern Corridor Project” are immense, currently at about 18.5 bn Euro; overall cost including feeder pipelines and financing expenses is said to exceed a striking 56 bn Euro. Out of the total, more than 80 percent will be paid by Gazprom and the rest by its foreign partners.15
Furthermore, the Yamal-Europe pipeline connects the Yamal fields with Poland and Germany via Belarus (33 bcm/a) since 2006. A Yamal- Europe II extension is currently under discussion. Turkey is connected to Russia by the Blue Stream pipeline under the Black Sea.
Figure 10: Main Gas Transportation Networks from Russia to Europe
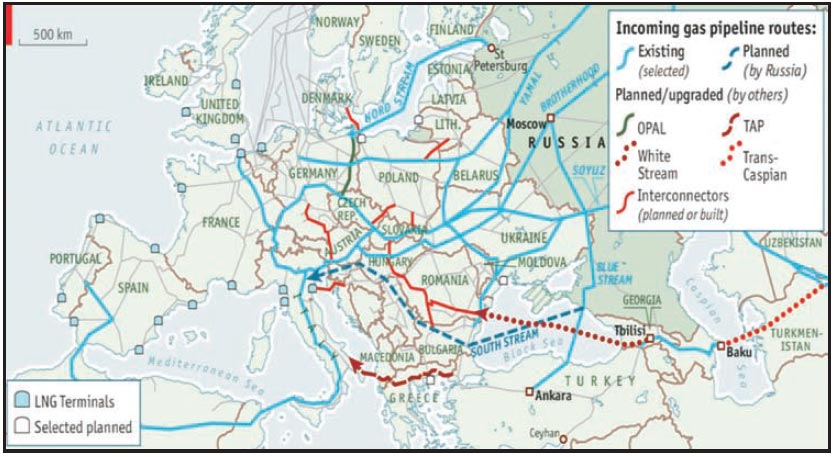
Source: The Economist (2014).
Ukraine itself is heavily dependent on Russian gas imports, since its indigenous production covers only about one-third of overall gas needs. However, in a case of emergency (i.e. if Russia really is keen enough to cut down supplies to Ukraine), flows in Europe's pipeline system might be reversed to some extent and Ukraine could be supplied from the west. In fact, German energy company RWE has already entered into an agreement with Ukraine to make gas deliveries (up to 10 bcm/a) possible and has commenced supplies to Ukraine mid-April 2014 against the backdrop of Russia threatening supply cuts and sharp price rises. The gas is being delivered via Poland and involves gas from the EU, Norway and Russia (redirected). Platts assessed the German spot price (GASPOOL day-ahead) to be about 31 percent below the price Ukraine had to pay for its Russian deliveries after the 80 percent price hike in April 2014. Furthermore Slovakia and Hungary are seeking solutions to eventually accommodate their eastern neighbour with gas supplies. A new supply route via Slovakia might increase the gas import capacity from the west up to 25 bcm/a (from the current 10 bcm/a via Poland and Hungary).16
The Role of Gas Storage in Europe
Thanks to Europe's mildest winter since 2007, the European gas market is quite well positioned with enough gas in storage to cover any future disruption in flows from Ukraine for about 45 days. European inventories were almost half full as of beginning March (from only 37 percent compared to the previous year). According to gas analysts, the volume in storage is equal to about 1.5 months of imports from pipelines running through Ukraine.17 Natural gas flows through Ukraine vary by season, ranging from about 340 million cubic meter per day (mcm/d) in the winter to only 170 mcm/d in the summer, reflecting the economics of distinct demand seasonality in Europe. This will give some relief to short-termed gas cutting measures since European demand will be significantly lower in the summer period due to lower heating requirements backed by high storage levels.
The low-demand season traditionally serves as an opportunity to fill up storage capacities again to be used for the next heating period in winter. Failing to refill these capacities would definitely lead to significant market and price distortions throughout the North-West-European (NWE) gas trading hubs and exchanges.
Generally, Europe is well served with gas storage capacity (Figure 11). Gas in storage is traditionally used for seasonal balance and security of supply purposes (however, with evolving market conditions the flexibility offered by storage sites is becoming more and more commercialised according to price volatility).
According to CEDIGAZ, there are about 130 underground gas storage sites with a combined storage capacity of approximately 100 bcm at work throughout Europe plus some expansions under way. It should be noted that storage availability differs regionally: Germany, Italy and France alone combine about half of the working gas capacity and 60 percent of the daily withdrawal rate. CEDIGAZ states that the ratio of working gas capacity to gas demand significantly varies by country: for instance, taking two main gas markets, the ratio is 26 percent in Germany but only 7 percent in UK.18
Since overall storage capacity has increased by 60 percent since 2008 but gas demand by only 8 percent, one can assume that the European storage system can provide a buffer for at least the short term (say for a more 'easy' summer period) against a supply cutback or cut-off (irrespective of the network and flow/distribution capabilities and requirements). It should be noted that Ukraine too is an important player in gas storage and as such plays a crucial role in transit and balancing supplies to the EU.19
Figure 11: Total Gas Consumption and Gas Storage incl. Extensions (2012, 2013)
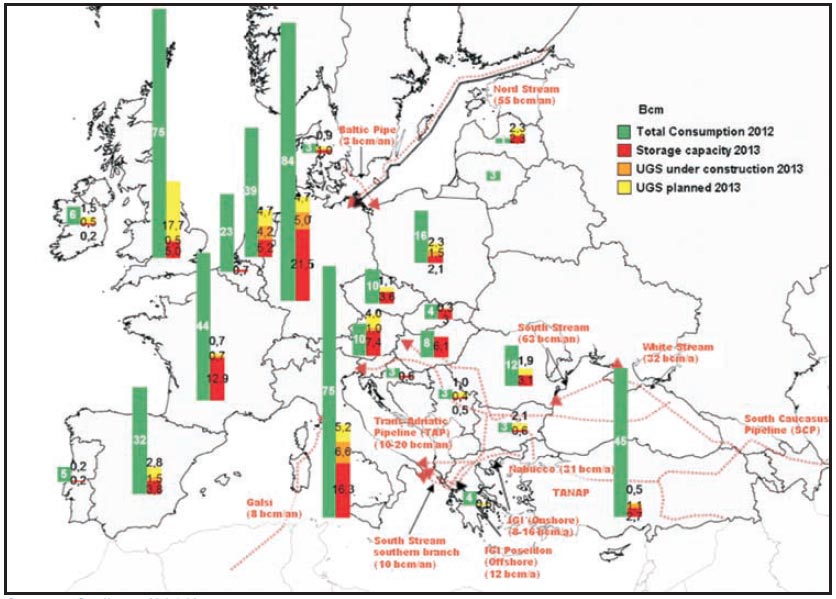
Source: Cedigaz (2013).
The Supply and Demand Framework – is Europe able to save its neck?
Current natural gas demand in EU-28 is at about 450 bcm/a of which only one-third is supplied from indigenous production and about twothirds has to be imported from various sources via pipeline and LNG (Figure 7). However, the long-term story of an expanding European gas industry has to be rewritten after the global economic crisis in 2008. As highlighted in Figure 12, there is so far no real gas demand recovery identifiable: IEA (2013a) expected that in 2013 OECD Europe's demand will deteriorate even further to demand levels last seen in 2002. Since the downturn is across all sectors,20 the IEA furthermore states a bleak outlook for European gas demand until the end of the decade with only weak recovery potential.21 European Commission's “EU reference scenario 2013” expects even more demand reduction until 2020 with an average annual drop of almost 1 percent of gross inland gas consumption and then a more or less stable level until 2050. In general, aside from specific scenarios (for example climate change mitigation), the expectations on future European gas demand can be summarised as being very moderate (in either direction).22
Figure 12: European Gas Demand (2000-2018, OECD Europe)
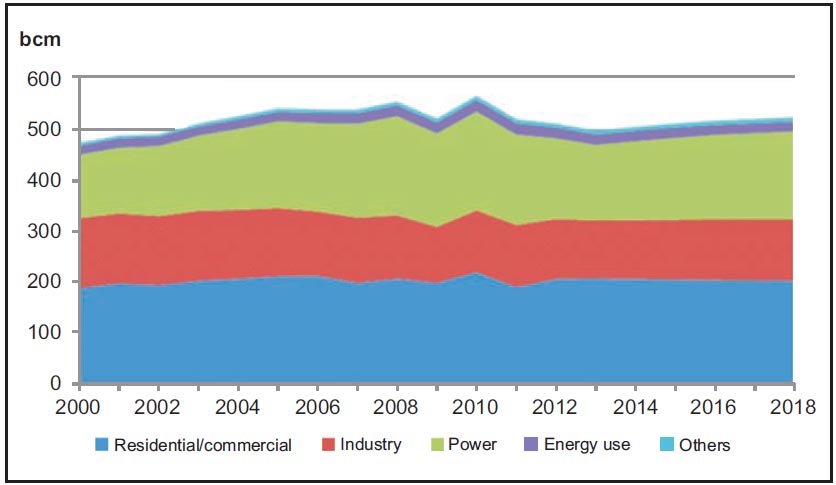
Source: IEA (2013a).
Opposite to the more or less stable demand prospects, indigenous gas production in the EU member countries faces an ongoing trend of steady decline that started about a decade ago.23 The downturn is aggravated by the fact that the Dutch government has announced a cut in gas production from the Groningen gas field by 15-20 percent due to fears about earth tremors.24 Groningen is still Europe's most productive gas field and the Netherlands is still the largest gas producer in the EU. Due to its ability for profiled output (versus mostly flatter profiles from long-distance pipeline imports), the Groningen field provides the important role of being the swing supplier for the NWE gas markets.
Since there is generally no rebound in conventional gas production to be expected,25 the consequent opening supply gap has to be filled up by means of a higher share of imports (pipeline and/or LNG) or by greater efforts to extract indigenous unconventional gas reserves. However, in the short term the production systems might be technically and contractually strained to their maximum capacity, which limits the scope of some extra inner-EU gas production. Nonetheless, some relief (at least for mid-term) might be possible if the Dutch government could be emboldened to reconsider its decision of cutting down gas production from the Groningen field to 40 bcm by 2016 (from almost 54 bcm in 2013).
Unconventional Gas – the Lifeline?
According to a recent study by ARI (2013), Europe holds about 25 trillion cubic metres (tcm) of technically recoverable shale gas. This is about one-third of total conventional reserves in Europe and Eurasia that are essentially concentrated in Russia and Turkmenistan. There are various geological, social and economic reasons why Europe is very likely to be less prospective than North America. It must be stated that under current conditions, shale gas is unlikely to become a game changer in Europe in the near and mid-term. IEA (2013b) expects that unconventional gas production in the EU will only climb to 20 bcm/a by 2035 in its standard New Policies Scenario, and before 2020 there is nothing significant to be expected. Interestingly, two of the most dependent countries on Russian natural gas have turned out to be the most promising unconventional gas producers: the largest share of EU shale gas production is dedicated to Poland, Moreover Ukraine, although outside the EU, holds a lot of shale promise as well. At the same time, there is little progress in the EU in this regard since fracking has been banned in several states due to political and/or social opposition (e.g. in UK, Germany and France). Furthermore, since first flow-rates in Poland have not been very promising, some of the big players like ExxonMobil have already exited.
Notwithstanding that, backed by more political will and an adequate regulatory framework ideally at the European level, some of the resistance might be overcome in order to push forward the development of fracking in the EU in order for it to become a sound source of indigenous gas supply. IEA (2012) has illustrated this through its provoking scenario based on the “golden rules for a golden age of gas”. The report highlights that there is a critical link between the way governments and industry respond to the social and environmental challenges and the prospects for shale gas production. As a consequence, the EU might see a higher rate of unconventional gas production that is slow to take off but accelerates in the longer term as confidence grows according to the effective application of the “Golden Rules”.
Numerically speaking, the IEA projects the EU's unconventional production to only rise to roughly 10 bcm by 2020, but thereafter enjoy a surge up to almost 80 bcm/a by 2035. Shale gas is then expected to meet about half of the EU's total gas production, and, as a result, growth in unconventional production might offset steady decline in conventional output from 2020 onwards (figure 13).
Figure 13: Natural Gas Production in IEA's “Golden Rules Scenario”
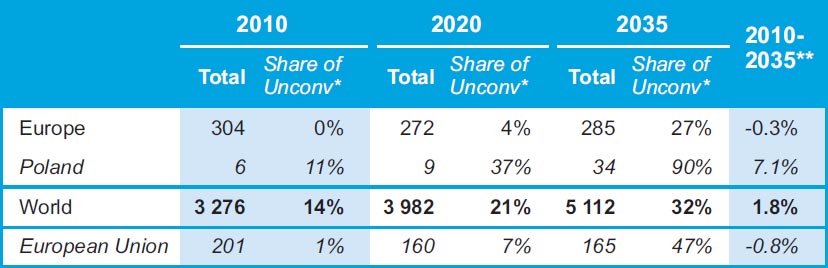
*Share of unconventional production in total natural gas production.
**Compound average annual growth rate.
Source: IEA (2012). Reassembled by author.
As a result, it can be stated that if broadly and actively supported, it might very well be possible that a huge part of Russian supply (at current rates, roughly 50 percent) could be substituted with shale gas production. However, if and to which extent shale gas production might be successful under laboratory conditions in countries with widely developed NIMBY26 manners and well-institutionalised and quite powerful protest organisations (e.g. Germany) will have to be seen. From today's perspective it is more likely that only a fraction of the assumed “Golden Rules” case volumes might be successfully placed on the market, not to mention that the information about shale gas in Europe (its geology, exploration, production and its economics) is still more or less in its infancy. Thus, even under pressure from politics, the prospect of a US-like shale gas bonanza in Europe is rather speculative and does not provide a sound and stable framework for political strategies against Russia.
Extended Pipeline Supply Options27
Existing pipeline import capacity into Europe is about 350 bcm (including Russia and excluding Norway). The average utilisation rate in 2011 was at roughly 60 percent on average; some spare capacity for additional pipeline imports might therefore be available, at least technically. Other factors like political or contractual matters, prices and overall requirements of a functioning gas import economy (e.g. load factors, seasonality as summer imports are usually used to refill storage, price optimisation options from different contracts (portfolios)) also come into play. The main inflow routes besides Russia are from Norway and North African countries (figure 14).
Figure 14: European Natural Gas Network 2013
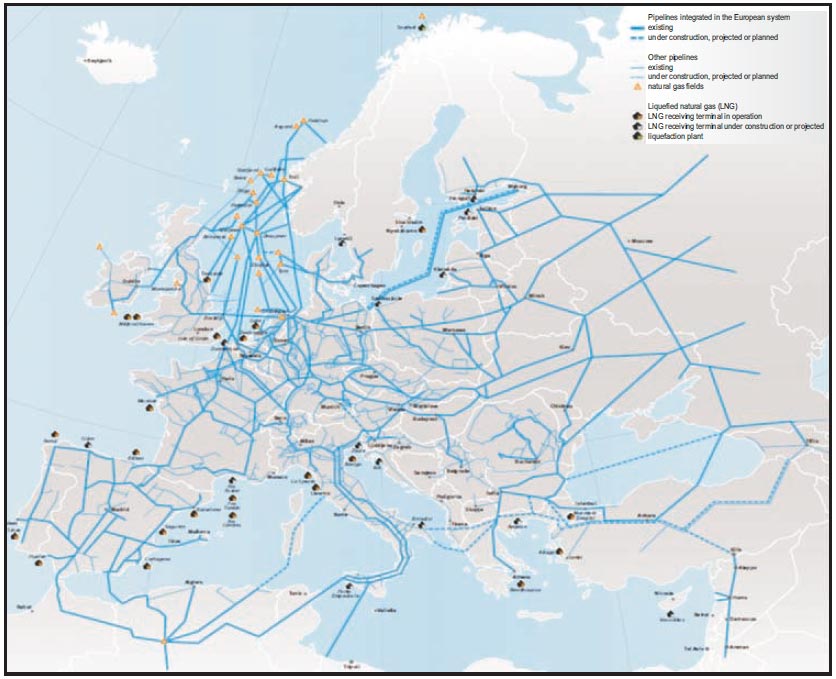
Source: Eurogas (2013).
In addition to indigenous production and imports from Russia, Norway is the most important gas supplier of the EU with a share of about onefifth of the overall EU-28 gas supply. It is furthermore regarded as more reliable in comparison with alternative supply options from Northern Africa or the Middle East, which are more problematic and fragile. Norway's gas production and transportation activity is quite mature. Gas transportation capacity to Europe is about 120 bcm/a. Gas piped from fields off Norway to receiving terminals in Germany, Belgium, France and the UK totalled almost 108 bcm in 2012 and set a new export record due to an aggressive pricing policy based on a higher ratio of lower spot- indexed prices,28 leaving a theoretical supply option of an additional 10- 20 percent to the European market provided that it can be delivered at highest load factors. Norway's recent production capacity has set a record in 2012 at 115 bcm, thus already operating at its peak. To sum up one can optimistically assume that Norway can manage to provide an extra 10 bcm annually on a regular export flow to Europe, primarily by using its spare swing capacity (usually used to fill up European storage sites during the summer months).
Anything beyond this will require significant investment in the enlargement of production and transportation capacities. Nevertheless, Norway could provide surplus gas to Europe in case of an emergency, i.e. if Russian cuts off flows through Ukraine: according to Norway's gas transportation network operator Gassco, an additional 130 mcm/d of extra gas could be made available for a period of one to two days (equalling more or less the daily amount of gas Russia is currently shipping through the Ukraine towards Europe).29
About 8 percent of EU's gas supply is being delivered by Algeria, mostly via the GME (Maghrib-Europe), Transmed and Medgaz pipeline systems to connect Spain and Italy with a total capacity of about 42 bcm/a and 8 bcm/a, respectively. Furthermore, the 8 bcm/a Galsi pipeline to Italy is expected to be commissioned in 2014. It should be noted that the bulk of Algerian export connections are directed to Spain which is interconnected with the rest of the European gas market in a very limited capacity. Even if this bottleneck is removed, there are serious doubts about the reliability of stable gas production and flows to Europe as the North African countries are facing several problems, including political instabilities (civil unrests in the aftermaths of the Arab Spring), security concerns and terrorism attacks (e.g. the hostage crisis at a gas facility in Algeria in January 2013), chronic underinvestment in gas production and transportation logistics, and a surging domestic demand. Algerian gas production and exports have declined in the last one decade; domestic consumption may exceed exports within a couple of years. According to The Economist (2013), supplies from Algeria were down by 40 percent in 2013. Italy's imports from Libya via the Green Stream were down by 12 percent as well. However, Libya is generally not expected to expand supplies by pipeline in the foreseeable future. As for the extension of the Arab Gas Pipeline from Egypt towards Turkey in order to move Egyptian gas to Europe, the prospect remains doubtful in the near future due to the current instability of the Egyptian gas sector and its persistent gas shortage.
Summing up, a considerable contribution from North African pipeline supplies to Europe can hardly be expected in the medium term, but “prerevolution” export levels could be resumed. Higher flows in the long run will require considerable investment in production and transportation as well as more stable conditions in the entire region. And since Algeria may hold quite substantial shale gas reserves, there exists at least an option for Europe to tap these within the coming decades.
The battle for the Southern Gas Corridor for setting up an appropriate gas transportation system in order to supply gas from the resource-rich Caspian and Middle Eastern regions to Europe was finally decided in mid-2013. The Shah Deniz II consortium chose the BP-led Trans- Adriatic-Pipeline (TAP)30 as the preferred pipeline project31 to ship Azerbaijan's gas towards Italy. TAP's scope for the initial phase is about 10 bcm from the Shah Deniz gas field with first deliveries to Europe expected late 2019. Since the pipeline's transport capacity can be expanded to more than 20 bcm/a without further constructions, this might open up a viable additional supply option for Europe, but only if the pipe can be concomitantly filled with gas. Beyond that, it remains to be seen if another pipeline consortium emerges in the near future that might tackle another Southern Gas Corridor project and/or if the EU sufficiently backs it politically and financially within their energy diversification priority projects (Trans-European Networks – Energy (TEN - E) programme).
Nonetheless, Europe can just as well stand to lose the battle for more gas from the Caspian Region as further delays may raise incentives for its Central Asian partners to turn towards the east. The rapid and successfully commissioning of the Turkmenistan-China gas pipeline should be regarded as a warning: China's gas hunger and the Turkmenistan-Afghanistan-Pakistan-India (TAPI) pipeline project will compete intensively for Caspian gas.
Supplementary Limitations: Long-term Contracts and Price Levels
One fact mostly overlooked during discussions of a natural gas boycott is that the private gas importing companies (e.g. E.ON, ENI, RWE) have signed private commercial contracts with their Russian counterparts (in most cases represented by the virtually state-controlled Gazprom). Most of the natural gas pipeline imports in Europe are still cemented in longterm Take-or-Pay (ToP) contracts that are usually agreed for a period of up to 20-30 years. To make sure that the huge upstream investments are paid off and the gas produced is sold, there usually exists a threshold of about 80 percent of the annually contracted volume which has to be paid for by the importer either way. Renegotiation clauses, while incorporated, are mostly geared towards prices and pricing. It is hardly conceivable that a gas boycott is a suitable legal basis to claim a reduction of contractual gas procurement obligations. As a result it has to be stated that at least 80 percent of the contracted pipeline import price from Russia to Europe has to be paid for far beyond the next decade by the European energy companies. This could result in an estimated volume of roughly 100 bcm/a. Thus, a reduction of the already contracted gas imports can only be conducted stepwise taking into consideration the timing of the expiring ToP contracts.32 Therefore, it has to be asked how fast Europe can be free of Russian gas contractually and to what extent it is contractually obliged to fulfil the contracts, respectively.33
Notwithstanding contractual issues, the question of bearing any additional costs needs to be resolved, since the importing companies will have to either forego from these gas imports or will have to substitute the Russian volumes with very likely higher priced volumes. Figure 15 shows the development of gas wholesale prices in Europe for various (still predominantly oil-linked) long-term import contracts in comparison with Spain LNG and UK NBP market price:
- As a rule of thumb one can state that due to the sustained high oilgas spread, the prices of pipeline gas imports (grey line: Platts NWE Gas Contract Indicator) are significantly higher than hub prices (red line: NBP spot) or LNG in Spain (blue line).
- Typically, the price for Russian gas imports to Germany (green line: average German border price) is among the lowest and among the highest to countries with high dependency on Russia (purple/brown line: Russian gas to Bulgaria/Lithuania).
- Moreover, the Troll-formula for import gas from Norway to NWE is usually expected to be somewhat costlier. The same goes for the Algerian pipeline gas that lands in South Europe, to which additional transportation costs would have to be added if it is used as a substitute in NWE.
In a nutshell, as Russian pipeline gas imports to NWE seem to be rather competitively priced compared to other supplies, one also has to accept substantial extra costs from alternative pipeline gas imports as a burden for any gas sanction or boycott against Russia.
Figure 15: Comparison of EU Wholesale Gas Price Estimations 2009-06/2013 (Euro/KWh)
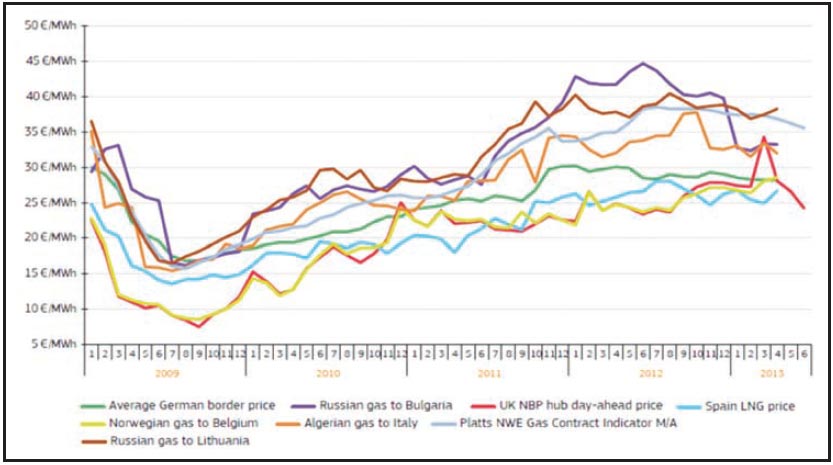
Source: EU (2013a).
A Viable Alternative: Setting foot in the global LNG market
More than one-fifth of the total global LNG regasification capacity (rLNG) is located at 22 sites in Europe with a combined natural gas import capacity of almost 200 bcm/a. Furthermore, six additions with an overall regasification capacity of about 30 bcm/a are either already under construction or committed, and further capacity additions are being planned (Figure 16). Spain and the UK are the most important LNG players in Europe with a combined share of more than half of Europe's current total LNG regasification capacity.
Figure 16: LNG Regasification Terminals in Europe (as of Feb. 2014)

Source: Gas LNG Europe (2014).
In general, LNG imports are expected to reduce Europe's dependence on pipeline imports, diversify the sources of its gas supplies and furthermore provide (arbitrage) opportunities from switching between LNG and pipeline supplies. By all means Europe's current import capacity is largely sufficient to meet growing mid-term import needs given that non-OECD Europe has a total import (pipeline plus LNG) capacity of 550 bcm/a available (of which about one-third can actually be attributed to regasification terminals).
However, Europe's LNG imports are in a downward trend since the second quarter of 2011, and the absolute LNG import volume went down by almost half within only two years until 2013.34 UK's LNG importers have lost more than two-thirds of their LNG import volumes since their peak in 2011. At the same time, the utilisation rate is dropping: by about half since 2011 and almost down to a mere 20 percent in 2013, with Spain and UK being even below the European average.35
This means that there are effectively about 150 bcm of idle LNG regasification capacities in the market that could be filled more or less immediately, if supplies were at hand. If one assumes that current reexport activity from Europe towards higher priced Asian LNG markets is of the order of about 5 bcm/a, these volumes should be available at short notice, because these are usually contracted in long-term purchase agreements. Apart from this, even if there are spot volumes available on the global LNG market, these can currently only be attracted by subsidies to overcome the wide price gap versus the Asian markets. (It is exactly this arbitrage option that is the economical incentive for the European LNG importers to re-export their already contracted LNG supplies towards Asia).
However, current global LNG prices are still reflecting the persistent (post Fukushima Daiichi) global pricing order. Due to the shale gas bonanza, the US prices remain at the very bottom at about $3-4/MMBtu. In contrast, the Asian premium markets of Japan, South Korea and China (and somewhat below them, India) are valued almost four times higher (more than $15/MMBtu), reflecting less supply alternatives, oillinked long-term contract pricing and/or surging demand. European LNG is priced in-between at about $10-11/MMBtu. To put it in a nutshell, even if Europe's rLNG terminals are significantly underused and even if there are sufficient LNG spot volumes available in the near term, Europe would have to pay Asian LNG prices, which at current price levels are more than one-third higher (figure 17).
Since liquefaction utilisation rates are usually very high for economic reasons and most volumes are already contracted or bound to Asian premium markets, it cannot be expected that any “emergency LNG” be diverted to Europe from the production side in the short term. Also, gas from additional trains that are going to be commissioned is generally already contracted.
In a rough calculation it can be assumed that pulling away 5 bcm/a from Asia to Europe would cost at least more than $1 bn at current prices and almost $18 bn to completely replace the volumes crossing through Ukraine into Europe.36 There is also a risk that LNG spot prices might even rise further if a European demand surge hits the market that is already short in supply. (For instance, Asian LNG spot prices have rocketed upwards to an unprecedented price level after the jump in Japanese LNG demand due to the Fukushima Daiichi nuclear disaster in March 2011).
Figure 17: Global Gas Prices 2007-2013 ($/MMBtu)
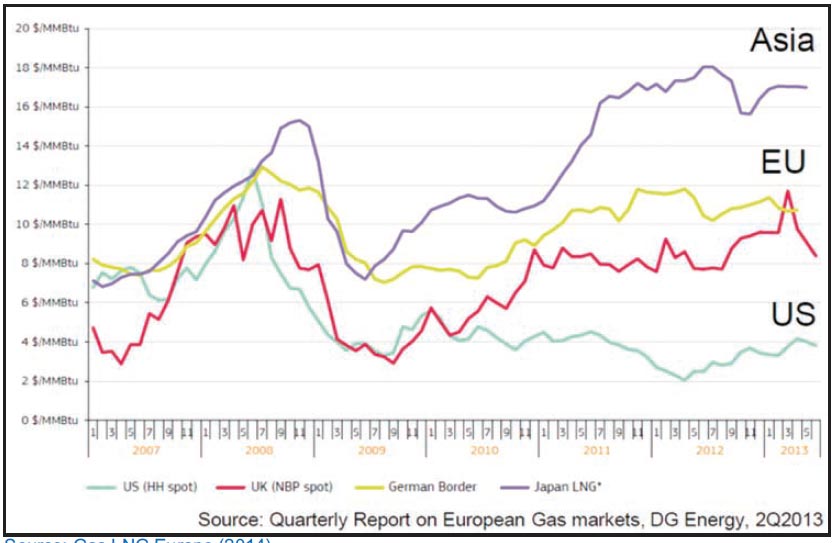
Source: Gas LNG Europe (2014).
In the mid-term the conditions might become brighter. On the one hand, it is expected that the rLNG capacities in Europe will develop further: in a business-as-usual-case an increase of about 80 percent can be realised by 2020. This corresponds to a growth of more than 150 bcm in absolute terms to reach more than 300 bcm/a by 2020 (figure 18). If one assumes a 50 percent utilisation rate, then another 100 bcm might be regasified by 2020 compared to current LNG imports. Backed by more political pressure (or regulatory and financial support), the development of rLNG expansion and usage could be accelerated and steered according to an optimisation of the operational system and network as well as distributional requirements to ensure that Russian gas flows can be replaced successfully.
For instance, most rLNG capacity is currently located in Western and Southern Europe, whereas Russian gas inflows are from the east. The bottleneck between Spain and the rest of Europe has to be paid attention to if capacities in Spain are to be considerably expanded. On the other hand, based on the ongoing shale gas boom in North America and coal seam gas in Australia, as well as new LNG projects in Africa, a significant ramp up of the overall global LNG liquefaction capacity by almost one-third from 2011 until 2017 is expected.37
Including the enormous upside potential from the US, the increase might even end up in an addition of about 50 percent of global liquefaction capacity between 2011 and 2018.38 Paired with some LNG demand mitigating developments in the Pacific basin (particularly the gradual restart of Japanese nuclear power plants in the short run and the development of Chinese shale gas in mid-term), this could rebalance the global LNG market in favour of LNG importers and concomitantly lead to a sustainable crunch of Asian spot prices: indeed, first analysts and models predict Asian prices coming down to European level within the next two years.39
Figure 18: LNG Regasification Capacity in Europe 2013-2022e (bcm/a)
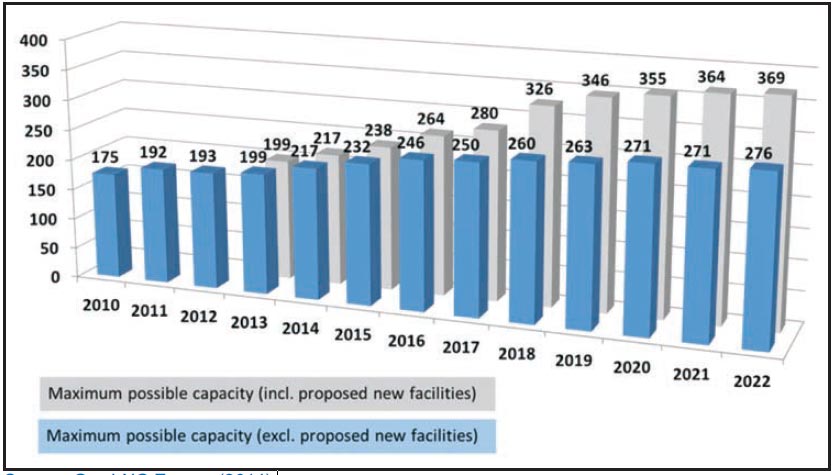
Source: Gas LNG Europe (2014).
In summary, therefore, even if the cited forecasts are fraught with uncertainties, they nonetheless indicate that the global gas trade might face a profound turnaround within the near future and might consequently offer good opportunities for the European gas industry to substitute significant amounts of Russian gas imports. Nevertheless, a higher willingness to pay or at least a sound willingness to accept a higher price risk on the spot market should eventually be approved, unless the opportunity arises to contract LNG volumes long term under reasonable pricing conditions. It is at this point that the Americans might come into play, since the U.S. government and Department of Energy (DoE) respectively hold all the aces to accelerate export permits for allowing U.S. LNG players to ship the gas to non-FTA40 countries (as all European countries are). Currently more or less 20 applications are pending. An additional wave of LNG could either bring spot prices down or could be offered directly to European LNG operators in a politically backed concerted action against Russia at politically set (cost-covering) prices. At current low Henry Hub prices this could be even economically viable; however, the economic loss is going to be revealed by the potentially lost profit that can be yielded by selling LNG to the premium Asian customers.
Against the backdrop of the fundamental supply substitution issue it should not be forgotten that the operability of the whole European natural gas infrastructure has been built up over decades and very much according to specific requirements, including national sector politics, import pipelines, LNG terminals, hubs, regional networks and storage (figure 14). Even if the EU has tried to reinforce, in recent years, the functionality and inter-operationality of the system towards the requirements of an integrated European network,41 it is still far from being successfully switched into an inverse mode at short notice.
Nevertheless, in response to the Ukraine shutdown in 2009, there are several improvements to be registered. For example, Russian gas now being delivered from the Nord Stream pipeline and the NWE hubs or LNG can be far better distributed towards South-East Europe (e.g. Austria, Czech Republic, the Balkans and even Ukraine) since new gas interconnectors have been commissioned. However, some more remote “gas islands” like the Baltics, Bulgaria and Greece are still regarded as particularly vulnerable to Russian gas cut-offs since alternative supply options via pipeline or LNG are rather limited or non-existent. Even Italy might be impacted severely by a disruption of transit gas through Ukraine due to a high overall gas demand, high share of gas in electricity generation (Figure 20) and high dependence on Russia (Figure 8).
The views expressed above belong to the author(s). ORF research and analyses now available on Telegram! Click here to access our curated content — blogs, longforms and interviews.

 PDF Download


.png)
.png)